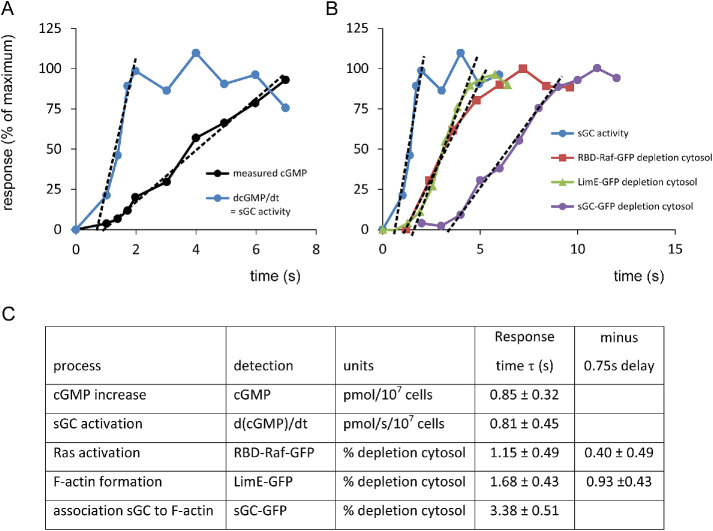
FIGURE 5:
Kinetics of cGMP-related responses. (A, B) Kinetics of the responses. Prestimulus levels are set at 0% and the maximal response at 100%. The data between 10% and 75% were subjected to linear regression. The intersection with the x-axis is τ, the onset time of the response in seconds. (C) Table showing the optimal values of τ and the 95% confidence levels. The cGMP response, sGC activity, and sGC-GFP translocations are real-time determinations. In contrast, Ras activation and the formation of F-actin are indirect measurements using sensors that translocate from cytosol to the boundary of the cell. These indirect assays have a delay that is estimated to be 0.75 s (see Supplemental Figure S1).

