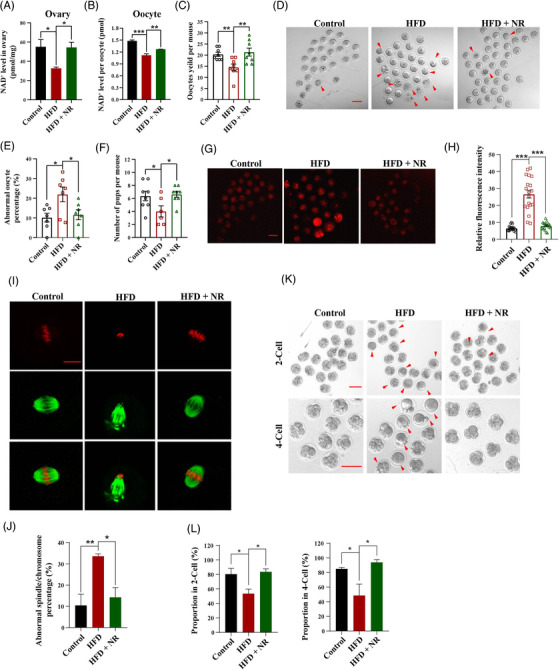
FIGURE 1.

Supplementation of NR attenuates the obesity‐associated decline in oocyte quality and improves early embryonic competence by increasing the NAD+ level. (A) NAD+ levels in ovaries from Control, HFD and HFD supplemented with NR mice (n = 6 for Control, n = 4 for HFD and n = 6 for HFD + NR). (B) NAD+ levels in single oocytes from ND, HFD and HFD supplemented with NR mice (n = 6 for Control, n = 4 for HFD and n = 6 for HFD + NR). (C) Number of ovulated oocytes in mice of each group after gonadotropin induction of ovulation (n = 8 for each group). (D) Representative images of MII oocytes from Control, HFD and HFD mice with NR supplementation. Arrowheads indicate abnormal oocytes with cytoplasmic fragments. Bar = 10 μm. (E) Percentages of abnormal oocytes from Control, HFD and NR‐supplemented HFD mice (n = 7 mice for each group). (F) Average numbers of pups per mouse after mating with fertile male mice with a normal bodyweight (n = 8 for Control, n = 6 for HFD and n = 8 for HFD + NR). (G) Representative images of ROS staining with MitoSOX in oocytes from Control, HFD and HFD with NR supplementation mice. Bar = 100 μm. (H) Quantitative analysis of MitoSOX fluorescence intensity in oocytes from each group (n = 21 for Control, n = 19 for HFD and n = 20 for HFD + NR). (I) Representative morphologies of spindles and chromosome alignment in oocytes from Control, HFD and HFD mice with NR supplementation. An anti‐α‐tubulin antibody (green) was used to visualise spindles and propidium iodide (red) was used to visualise chromosomal DNA. Bar = 10 μm. (J) Percentages of Control, HFD and HFD + NR oocytes with spindle (disorganised or elongated)/chromosomal defects (misalignment) (n = 3 mice for each group). (K) Representative images of 2‐ and 4‐cell embryos from Control, HFD and HFD + NR mice. Red arrowheads show abnormal embryos with fragments. Bar = 100 μm. (L) Percentages of embryos at 2‐ and 4‐cell stages from Control, HFD and HFD + NR oocytes after in vitro fertilisation (n = 3 mice for each group). * p < .05, ** p < .01, *** p < .001
