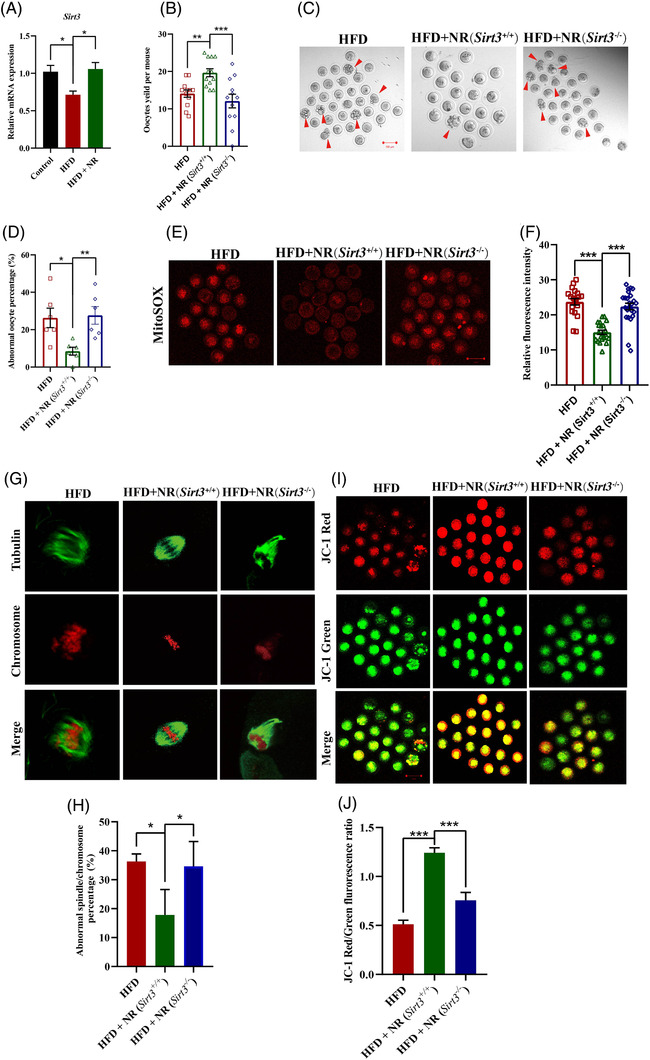
FIGURE 3.

Sirt3 depletion abolishes the improvement of HFD oocyte quality after NR supplementation. (A) Transcript levels of Sirt3 in oocytes from HFD, HFD + NR (Sirt3 −/−) and HFD + NR (Sirt3 +/+) mice (n = 79 oocytes for Control, n = 84 oocytes for HFD and n = 47 oocytes for HFD + NR). (B) Number of ovulated oocytes in mice of each group after gonadotropin induction of ovulation (n = 12 for each group). (C) Representative images of oocyte morphologies in each group. Arrowheads indicate oocytes with fragments. (D) Percentages of abnormal oocytes with fragments from HFD, HFD + NR (Sirt3 −/−) and HFD + NR (Sirt3 +/+) mice. Bar = 100 μm. (E) Representative images of ROS stained with MitoSOX. Bar = 100 μm. (F) Quantification of ROS levels in oocytes from HFD, HFD + NR (Sirt3 −/−) and HFD + NR (Sirt3 +/+) mice [n = 19 oocytes for HFD, n = 21 oocytes for HFD+NR (Sirt3+/+ ) and n = 24 oocytes for HFD + NR (Sirt3−/− )]. (G) Representative morphology of spindles and chromosomal alignment in oocytes from each group. Spindles were visualised by staining with an anti‐α‐tubulin antibody (green) and chromosomal DNA was stained with PI (red). (H) Frequencies of oocytes with abnormal spindle morphology (disorganised or elongated) were determined in each group (n = 3 mice for each group) (I) Representative morphology of oocytes from each group stained with markers to reflect mitochondrial activity. (J) Ratio of red‐to‐green fluorescence as an indicator of the mitochondrial membrane potential in each group [n = 21 oocytes for HFD, n = 21 oocytes for HFD+NR (Sirt3+/+ ) and n = 17 oocytes for HFD + NR (Sirt3−/− )]. * p < .05, ** p < .01, *** p < .001
