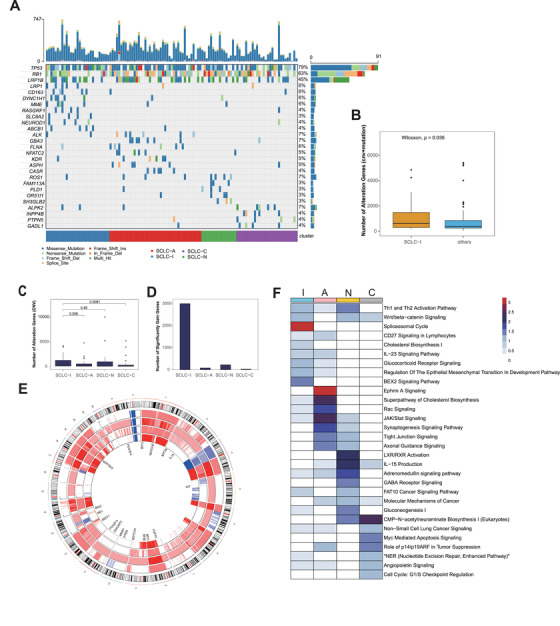
FIGURE 3.

Copy number alterations and mutations in the four small cell lung cancer (SCLC) subtypes. (A) Top bar graph shows the number of nucleotide substitution mutations in each patient. Tumour samples are arranged from left to right according to different subtypes. Genes with high mutation rate or significantly mutated in each subtype (prop.test) are shown in waterfall plot. (B) Total number of gene alterations (mutations, gene amplifications and deletions) in SCLC‐I versus the rest of SCLC specimens. (C) Number of copy number alteration genes (sum of amplified and loss genes) of all clusters. (D) Number of significant gain genes (p < 0.05) with high alteration frequency (>50%) in four subtypes. (E) Correlation network analysis (CNA) heatmap across all chromosomes using median copy number in each subtype. We replace copy number as follows: −2 <= 0, −1 <= 1, 0 <= 2, 1 <= 3, 2 <= 4 and greater. From outside to inside, there are SCLC‐I, SCLC‐A, SCLC‐N and SCLC‐C. Some significant alteration genes in each subtype are highlighted in the inner ring. (F) Pathway enrichment analysis (IPA) using significant amplified genes with high genetic alteration frequency (freq > 50%, p < 0.001 for SCLC‐I, p < 0.05 for others) in each subtype. Heatmap is colored by '−log10( p ‐value)'
