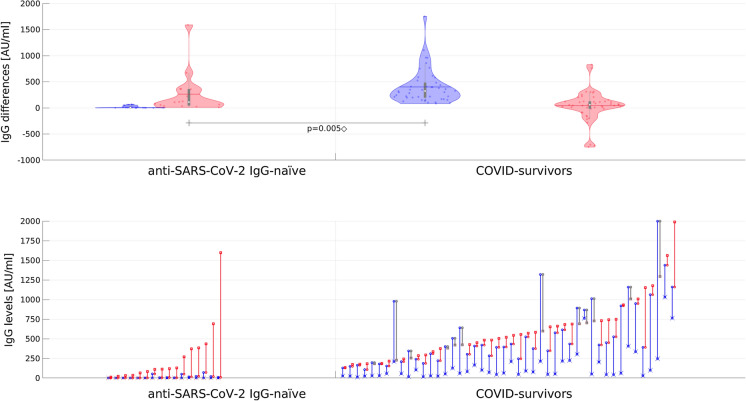
Fig. 3.
The effects of the first (blue) and second (red) BNT162b2 mRNA COVID-19 vaccine dose as a difference between anti-S titres noted during consecutive examinations (whiskers mark mean and IQR; y-axis is linear; only a group with two doses of vaccine is presented; n = 62). Lower chart shows the matching anti-S titers, sorted by the last measured level (blue and red denote positive change after, respectively, first and second dose; cases with the level lower after the second dose are colored gray). For clarity, the initial level is additionally marked with x while the final level (observed after second dose) with square. The ◇ symbol denotes a large effect in Kolmogorov–Smirnov test (p < 0.001) and Mann–Whitney test (p = 0.005)

