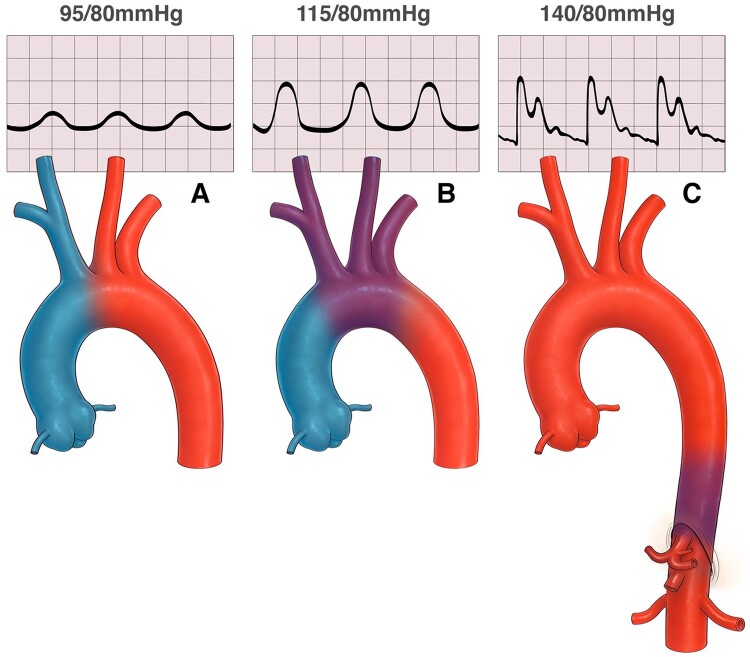
Figure 2.
Illustration of alterations in watershed zone as ventricle recovers. First panel (A) depicts poor ventricular function where most of the vascular run off is supplied by oxygenated blood from the retrograde flow of the peripheral extracorporeal membrane oxygenation. Second panel (B) shows a slightly improved ventricular function whereby the watershed zone has moved up into the aortic arch. Third panel (C) shows much improved ventricular and pulmonary function with the watershed zone low in the thoracic aorta.

