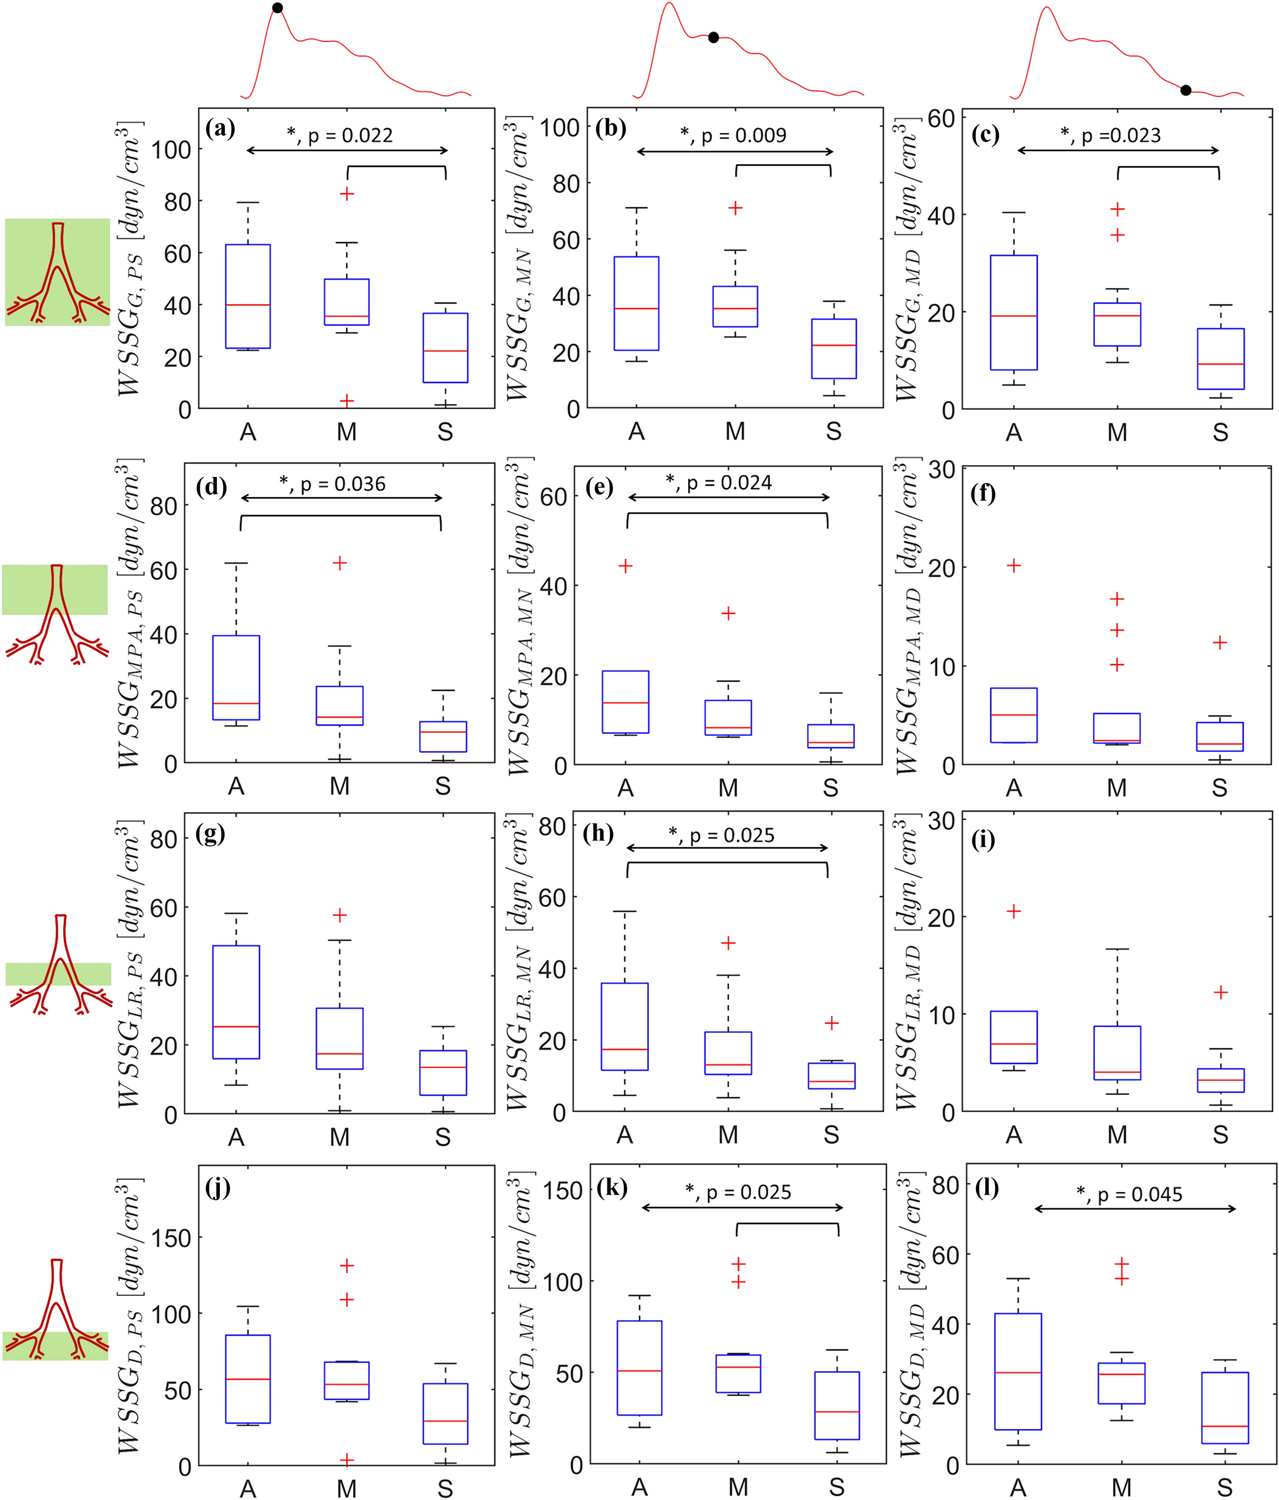
Figure 7:

Spatially averaged wall shear stress gradients (WSSG) calculated at peak systole (a, d, h, j), mid-notch (b, e, h, k), and mid-diastole (c, f, i, l). Region based spatial averaging is performed in three distinct regions: MPA (d, e, f), LPA+RPA (g, h, i), and the distal vasculature (j, k, l). The overall and pairwise statistical significances are represented by the topmost bidirectional arrow and square brackets underneath, respectively. The crosses represent outliers in each group (A, M, or S).
