
FIGURE 4.
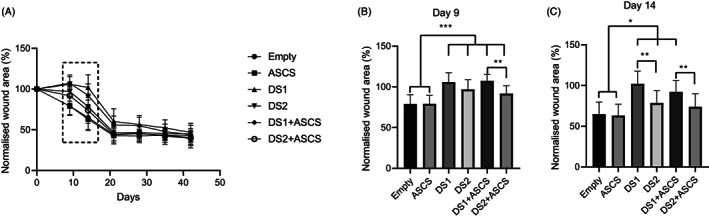
Percentage of normalised wound area to day 0 (n = 24), 9 (n = 24), 14 (n = 24), 21 (n = 14), 28 (n = 14), 35 (n = 14) and 42 (n = 14) for all treatments (A). Results shown as mean ± SD. Statistical analysis performed on day 9 (B) where **P < .01 and ***P < .001 and day 14 (C) where *P < .05, **P < .01 for normalised wound area