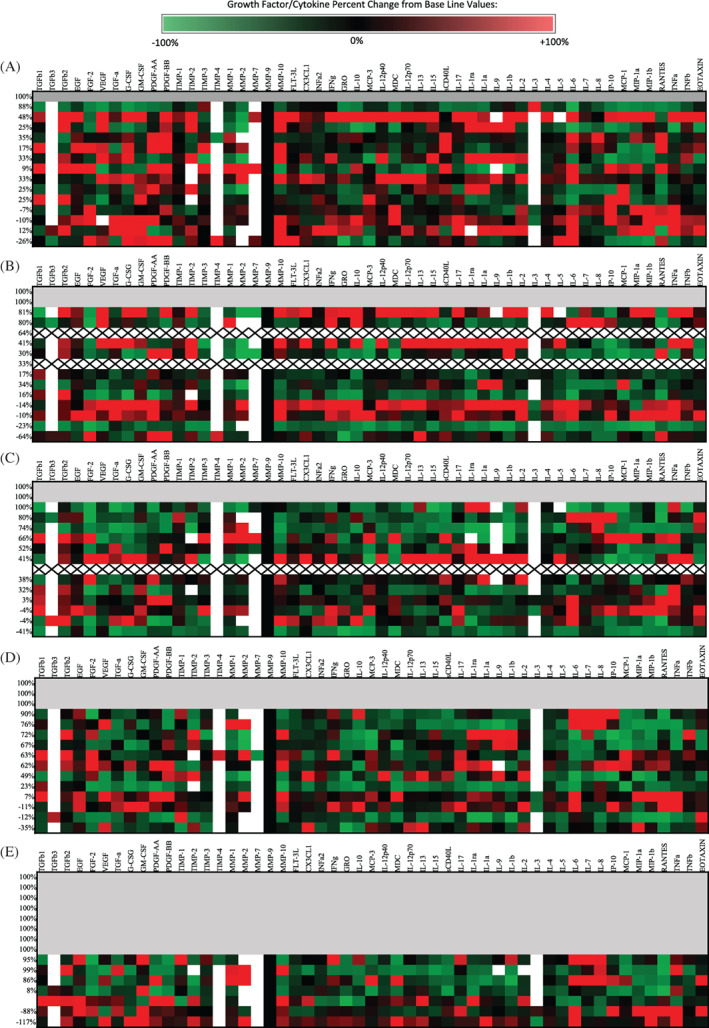
FIGURE 2.

Heat maps illustrating the changes in cytokine concentrations within wound exudate of venous leg ulcers (VLUs) relative to baseline values at (A) 1 week, (B) 2 weeks, (C) 3 weeks, and (D) 4 weeks. The respective wound closure for each subject at each time point is included along the left of each table. Grey shading indicates healed wounds, “X” indicates missing data due to missed visit, and white represent values which were outside the range of detection
