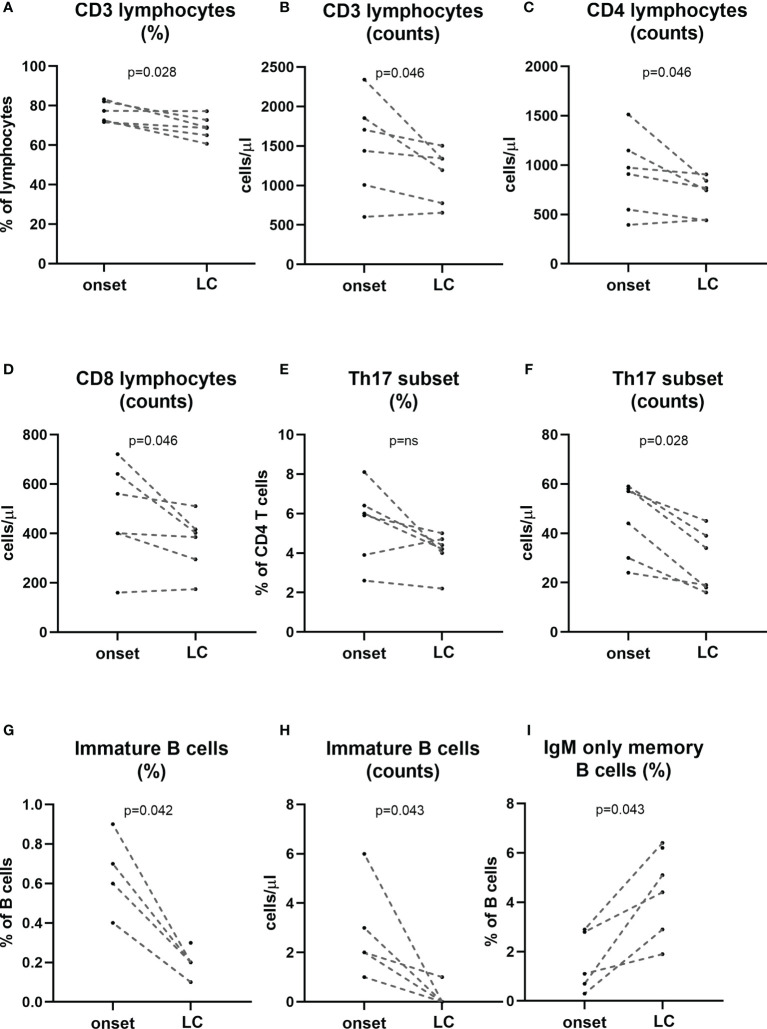
Figure 6.
Changes in lymphocyte subpopulations at established disease when compared with onset. A subgroup of patients (n=6) was followed-up at established disease (>2 years of evolution) and compared their own timepoint onset of the disease. Percentage and counts of CD3 (A, B), counts of CD4 and CD8 T cells (C, D), percentage and counts of Th17 cells (E, F), percentage and counts of immature B cells (G, H) and percentage of IgM-only memory B cells (I) at onset and long-course are represented for each patient. LC, long-course. (p < 0.05 significative; Mann-Whitney test).

