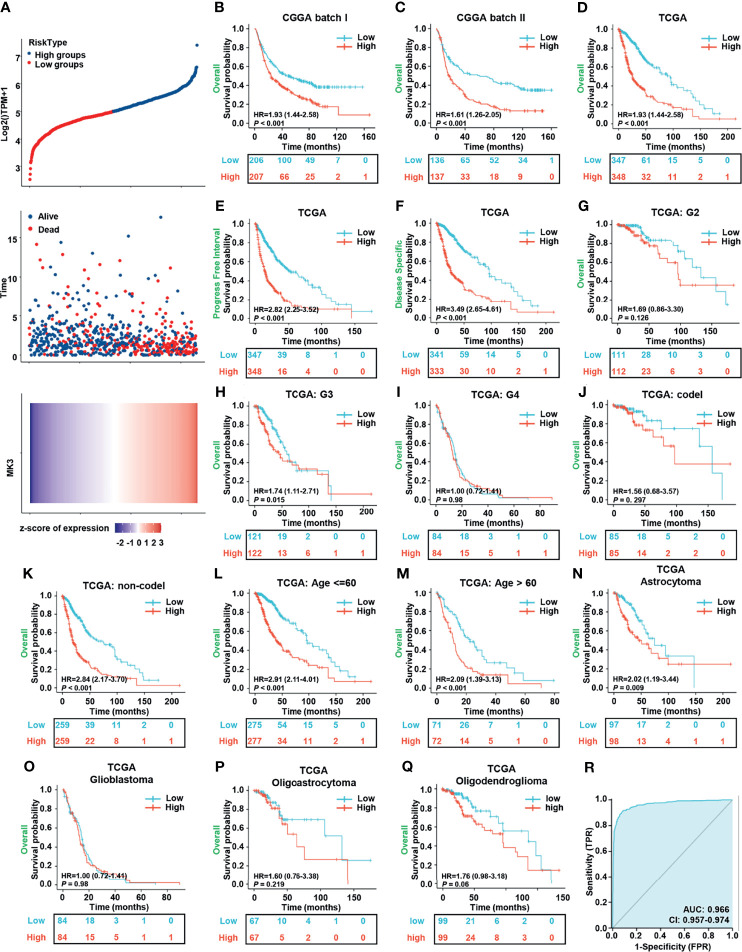
Figure 3.
Overexpression of MK3 was closely related to the poor prognosis of glioma patients. (A) The relationship between survival time, survival status of glioma patients, and MK3 expression in TCGA dataset. Top: the curve of risk score. The dotted line represents the median risk score and divided the patients into low-risk and high-risk groups. Median: scatter plot distribution of survival time and survival status corresponding to the MK3 expression of different samples. Bottom: heatmap of MK3 expression. (B, C) The KM survival analysis for the correlation of MK3 with overall survival of glioma patients in CGGA batch I (B) and batch II (C) datasets. (D–F) The KM survival analysis for the correlation of MK3 expression with OS (D), PFI (E), and DSS (F) of glioma patients in TCGA dataset. (G–Q) Different subgroup analyses of KM for overall survival including WHO grade G2 (G), G3 (H), G4 (I), and 1p/19q codeletion status: codel (J), non-codel (K), age less than or equal to 60 years (L), age greater than 60 years (M), and histological type astrocytoma (N), glioblastoma (O), oligoastrocytoma (P), and oligodendroglioma (Q) of glioma patients in TCGA dataset. (R) ROC curve of GBM, LGG tissues (n = 1,157), and normal brain tissues (n = 689) from TCGA and GTEx databases for validating the diagnostic value of MK3 in glioma patients. TCGA, The Cancer Genome Atlas; KM, Kaplan–Meier; CGGA, Chinese Glioma Genome Atlas; OS, overall survival; PFI, progression-free interval; DSS, disease-specific survival; ROC, receiver operating characteristic; GBM, glioblastoma; LGG, low-grade glioma; GTEx, Genotype-Tissue Expression.

