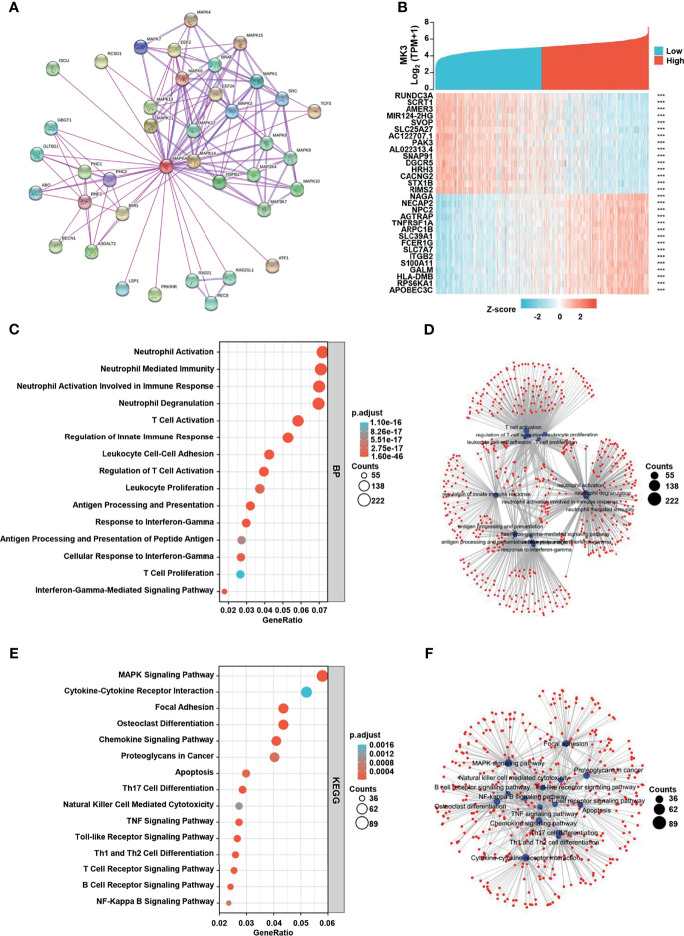
Figure 4.
MK3 related gene enrichment analysis. (A) The protein–protein interaction network analysis of MK3 by using the STRING tool. (B) The top 15 genes with positive and negative correlations of MK3 expression. (C) Based on the MK3 related genes, GO analysis was performed. (D) The cnetplot of biological process in GO analysis. (E) KEGG pathway analysis of MK3 related genes. (F) The cnetplot of KEGG pathway analysis. Data used for GO and KEGG analyses were obtained from TCGA. GO, Gene Ontology; KEGG, Kyoto Encyclopedia of Genes and Genome; TCGA, The Cancer Genome Atlas.

