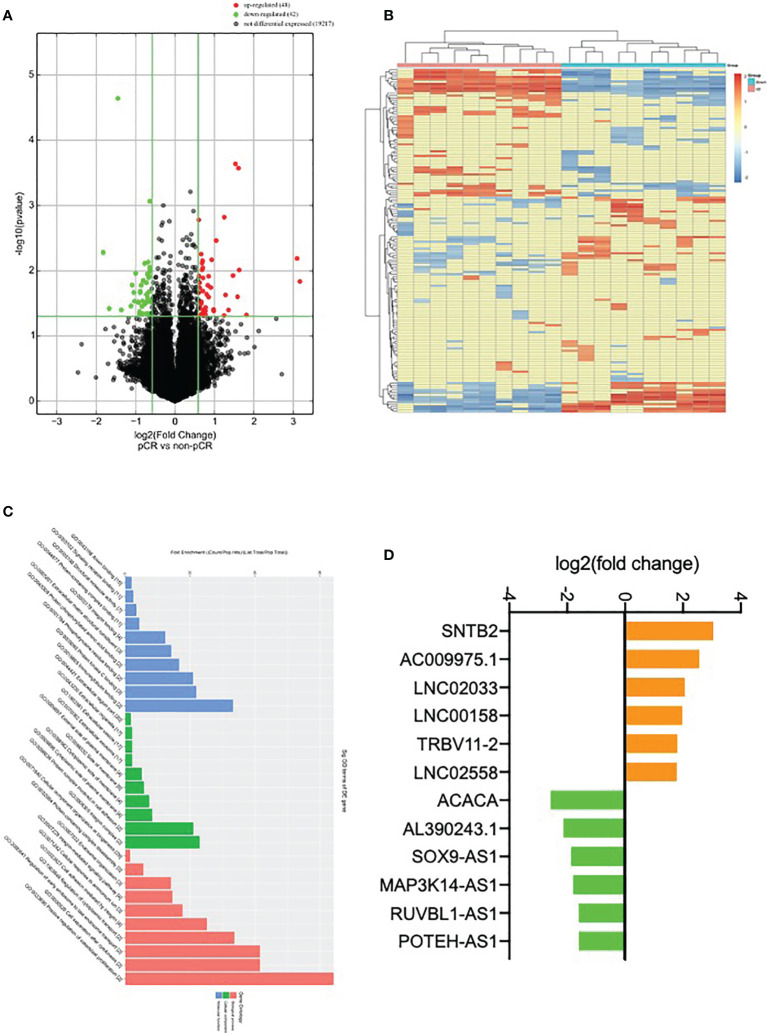
Figure 1.
Identification of differentially expressed lncRNA. (A) Volcano plot compared the expression fold change of lncRNA for ypT0N0 and ypT+N+ tissues; (B) a heat map was generated after supervised hierarchical cluster analysis. LncRNA is shown in red (upregulation) versus blue (downregulation); (C) GO analysis of lncRNA in ypT0N0 and ypT+N+ tissues; (D) 12 selected lncRNAs are shown in yellow (upregulation) versus green (downregulation).

