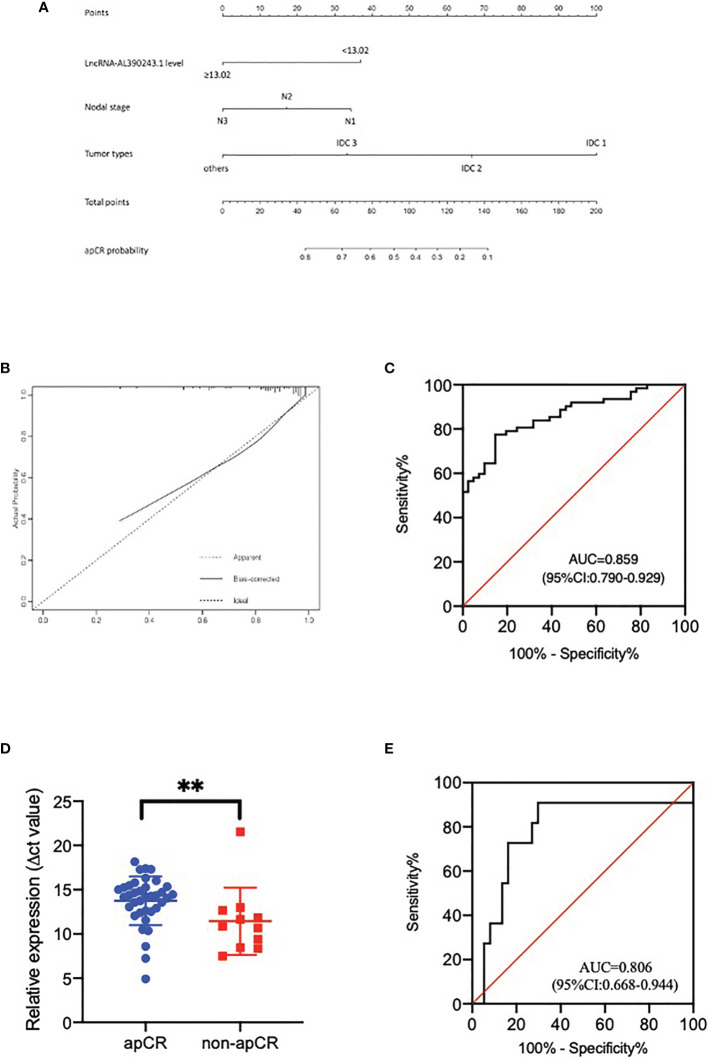
Figure 4.
(A) The nomogram to predict patients with apCR. To calculate the probability of apCR, the scores for the three factors were summed up. And the total scores and bottom risk scale were referenced. (B) The calibration curve showed a satisfactory fit between the predictive and actual observation. (C) The ROC curve of the nomogram. (D) The different expression of lncRNA-AL390243.1 in tissues in the apCR group and non-apCR group among patients with cN1 disease. **p < 0.005. (E) The AUC of lncRNA-AL390243.1 was 0.806 among patients with cN1 disease.

