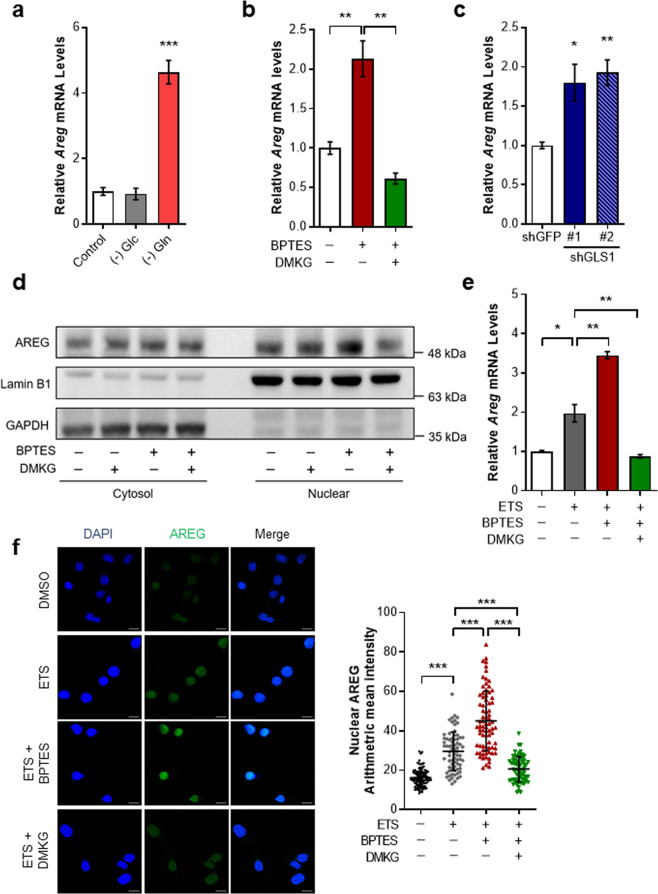
Fig. 2. Mitochondrial Gln metabolism modulates AREG expression.
a Relative AREG mRNA levels in immortalized MEFs incubated with or without Gln or Glc for 24 h (n = 3). β-actin was used as an endogenous control for qRT-PCR. b Relative AREG mRNA in cells treated with BPTES and/or DMKG (n = 3). c Relative AREG mRNA levels in HeLa cells expressing a control shRNA or two independent shRNAs to GLS (n = 3). d AREG protein levels in cytoplasmic and nuclear fractions of cells treated with BPTES, DMKG or both. GAPDH and LaminB1 were used as cytoplasmic or nuclear loading controls, respectively. e Relative AREG mRNA levels in cells treated with ETS in the presence of BPTES, DMKG or Both (n = 3). f Immunofluorescent staining was performed with nuclear marker (DAPI) and anti-AREG antibody on cells treated with ETS in the presence of BPTES or DMKG (DMSO: n = 100, ETS: n = 72, ETS + BPTES: n = 77, ETS + DMKG: n = 67). Scale bars represent 2 µm. The nuclear mean intensities of AREG as indicated (right). All error bars ± SEM. *p < 0.05, **p < 0.01 and ***p < 0.001.

