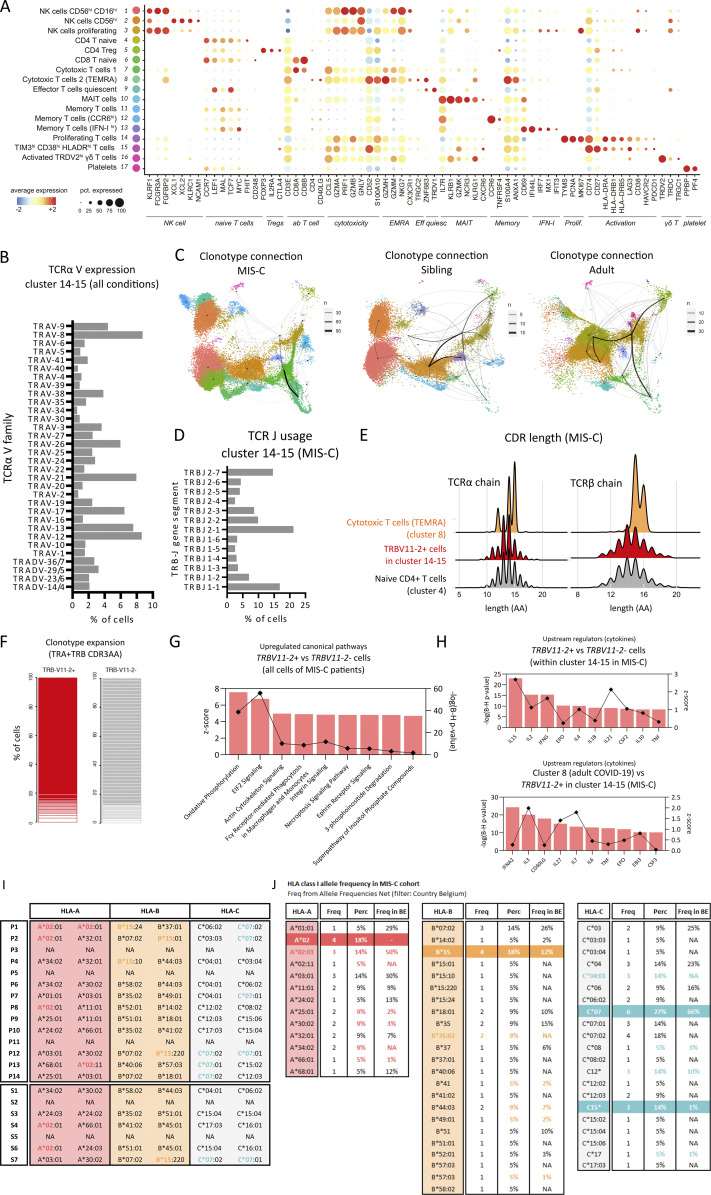
Figure S4.
Single-cell TCR profiling reveals an activated and proliferating population with skewed TCR repertoire, suggestive of superantigenic stimulation of TRBV11-2+ cells. (A) Dot plot depicting signature genes defining the UMAP clusters shown in Fig. 5, A and B. (B) TRA-V gene family usage within clusters 14 and 15 among all conditions. (C) Clonotype connection plots linking UMAP clusters with shared clonotypes. Line widths depict number of overlapping clones. UMAPs are split based on patient condition. Clonotypes are defined by TRB + TRA CDR3AA sequences. (D) Barplot depicting TRBJ gene segment usage within clusters 14 and 15 of the MIS-C condition. (E) Ridgeplot depicting CDR3 length (number of amino acids) within TRBV11-2+ cells of clusters 14 and 15 of the MIS-C condition (red) versus cytotoxic T cells (TEMRA) of cluster 8 (orange). The CDR3 length of cluster 4 (naive CD4 T cells) is presented as a reference (gray). (F) Stacked bar graphs showing clonotype expansion within TRBV11-2+ and TRBV11-2− cells of clusters 14 and 15 of the MIS-C condition. Clonotypes are defined by TRB + TRA CDR3AA sequences. (G) Up-regulated canonical pathways as identified by IPA on DEGs of TRBV11-2+ cells as compared with TRBV11-2− cells for MIS-C patients within cluster 14 and 15. Pathways were ordered on their Benjamini–Hochberg-corrected P value (bars) and filtered on pathways with a positive z-score (squares). (H) Upstream regulators with a filter on cytokines as identified by IPA on DEGs of TRBV11-2+ cells as compared with TRBV11-2− cells for MIS-C patients within clusters 14 and 15 (top) and on cells of adult patients with severe COVID-19 within cluster 8 as compared with TRBV11-2+ cells of MIS-C within clusters 14 and 15 (bottom). Cytokines were ordered on their Benjamini–Hochberg-corrected P value (bars) and filtered on cytokines with a positive z-score (squares). (I) HLA clonotypes for MIS-C patients and siblings (J) compared with local reference frequencies. Eff quiesc, quiescent effector; Freq, frequency; NA, nonavailable; pct., percent; Prolif, proliferating; Perc, percent; Tregs, regulatory T cells.

