
FIGURE 1.
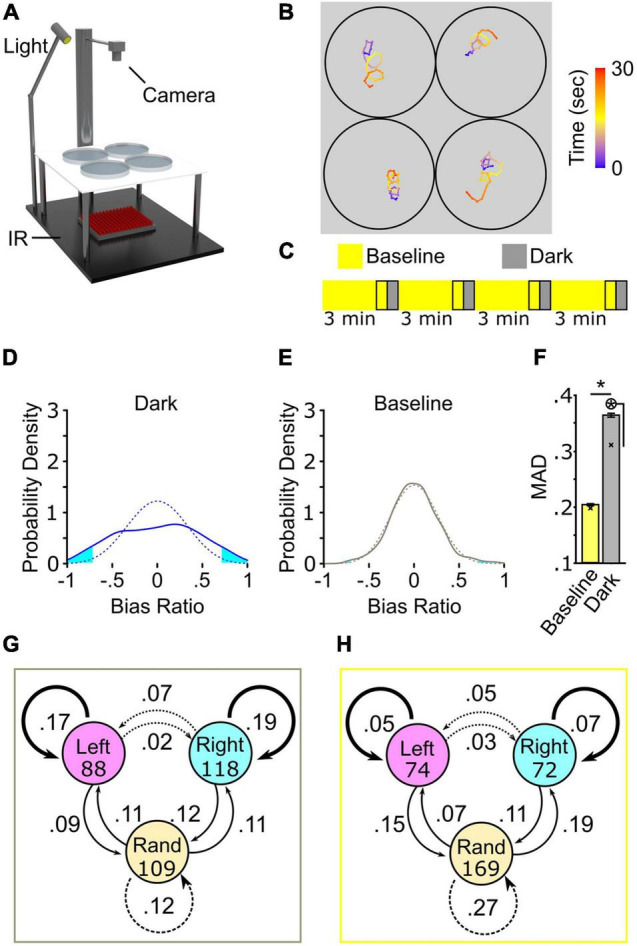
Turning behavior following the loss of light exhibits high inter-individual variation. (A) Schematic of multiplex recording rig. (B) Illustrative path trajectories following loss of light from multiplex recording. Color scale is time (seconds). (C) Diagram of 4× recording. Outlined regions denote recording intervals. (D–F) 4× recordings strategy to show high inter-individual variation in turn bias. (D) Average bias ratio probability density curve for dark responses (solid blue line, N = 374) and paired curve following reshuffling (dotted blue line, average of 1,000 resampled datasets). (E) Same as (D) except the paired baseline responses (solid gray line, N = 374) and random permutation density curve (dotted gray line). Cyan fill shows the area in each tail corresponding to the probability of observing a result more extreme or equal to ±0.3 average bias ratio. (F) MAD for baseline (yellow), and dark (gray) responses. N = 374. Error bars are 95% confidence intervals generated by bootstrap resampling. Asterisk in circle, p < 0.05 to MAD permutation value shown with an X. (G) Dark responses (gray outline) and baseline (H) (yellow outline) from 4× recording showing frequency of direction change between first (circles) and second (arrows) pairs of responses. Initial N shown in circles. Bold, solid, and dotted arrows delineate responses that produce perfectly matched bias, partial bias, and unbiased responses, respectively.