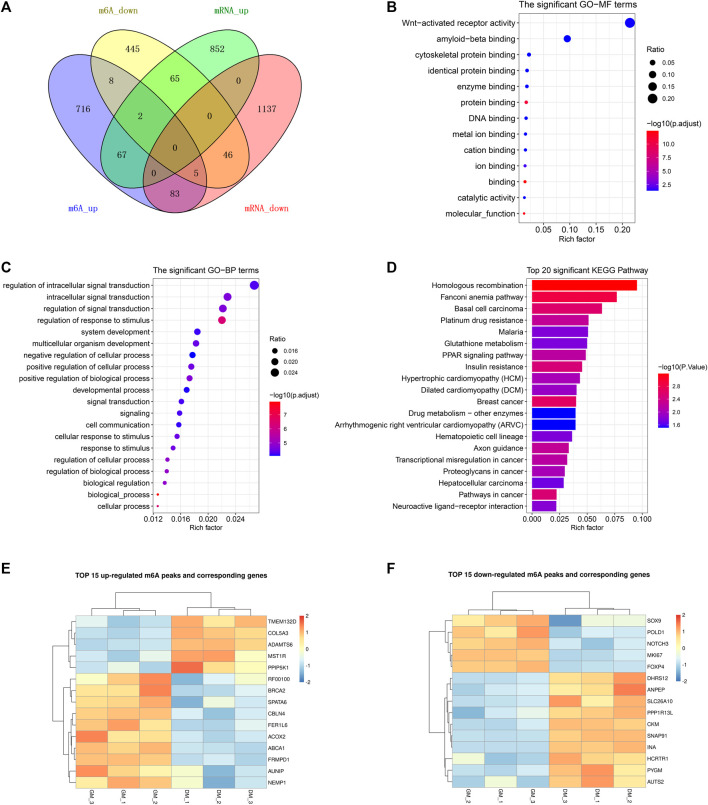
FIGURE 5.
Conjoint analysis of m6A-seq and RNA-seq data. (A) Venn diagram showing the overlapping genes between DMPs and DEGs. (B) GO analysis of molecular function for common genes between DMGs and DEGs. (C) GO analysis of biological process for common genes between DMGs and DEGs. (D) KEGG analysis of common genes between DMGs and DEGs. (E) Heatmap of 15 genes mRNA expression in Table 3. (F) Heatmap of 15 genes mRNA expression in Table 4.

