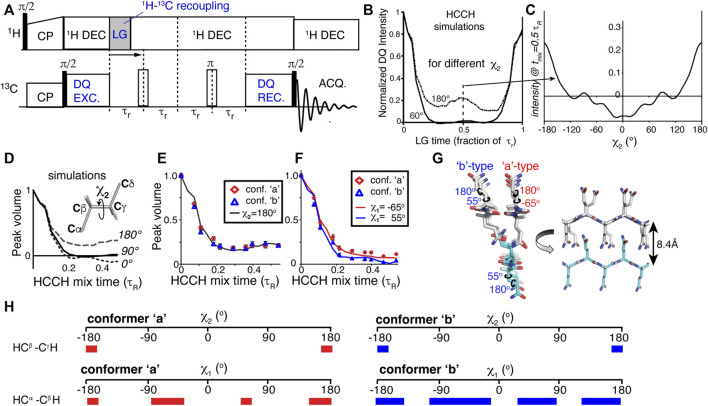
FIGURE 4.
HCCH experiments for measuring side chain angles. (A) Pulse program schematic for a HCCH experiment. (B) Simulated HCCH curves for measurement of the χ2 angle in glutamine residues (a CβH2-CγH2 spin system), for χ2 = 60 or 180°. (C) Variation of the mid-rotor-period intensity as a function of the χ2 angle. (D,E) Simulated and experimental data measuring the χ2 angle of glutamine residues in the core of polyglutamine amyloid. (F) Application to the χ1 angle in polyglutamine amyloid. (G) Visualized structural model for how the polyglutamine amyloid core is structured, based on the best-fit dihedral angle solutions. (H) Overview of the ambiguity in some, but not all, of the measured χ angles. The colored bars indicate those angles that are consistent with the observed torsion angle curves. The red bars on the left apply to conformer ‘a’, and the blue ones (right) to conformer ‘b’. Figure adapted from ref. (Hoop et al., 2016) with permission.

