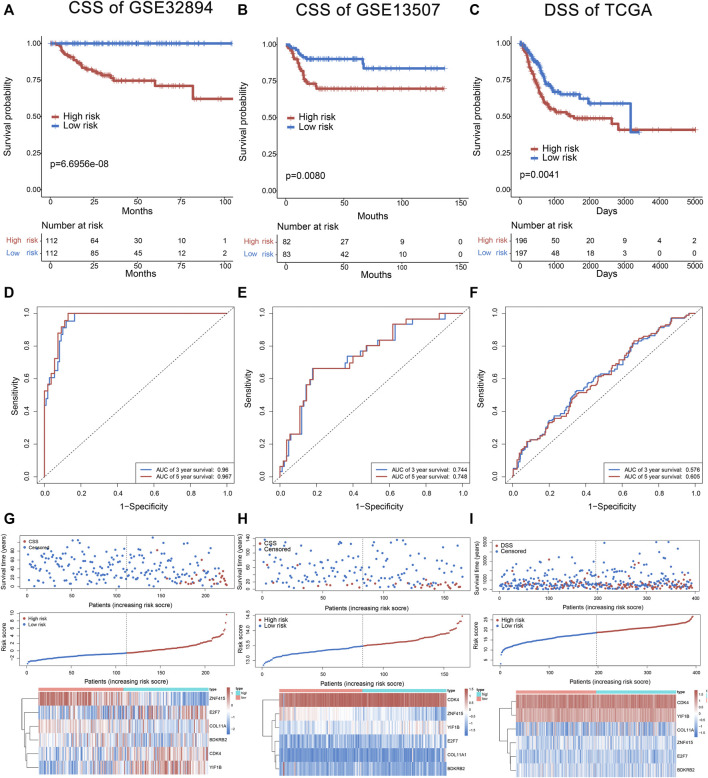
FIGURE 3.
The six-gene signature in the prognosis of cancer-specific survival of bladder cancer patients in the training set and test sets (GSE13507 and TCGA). The Kaplan–Meier curves of survival between high-risk and low-risk patients in the training set and test sets (A–C). The ROC curve for survival prediction by the six-gene signature within 3 and 5 years as the defining point in the training set and test sets (D–F). The six-gene risk score distribution, survival of patients, and heatmap of the six-gene expression profiles in the training set and test sets (G–I).

