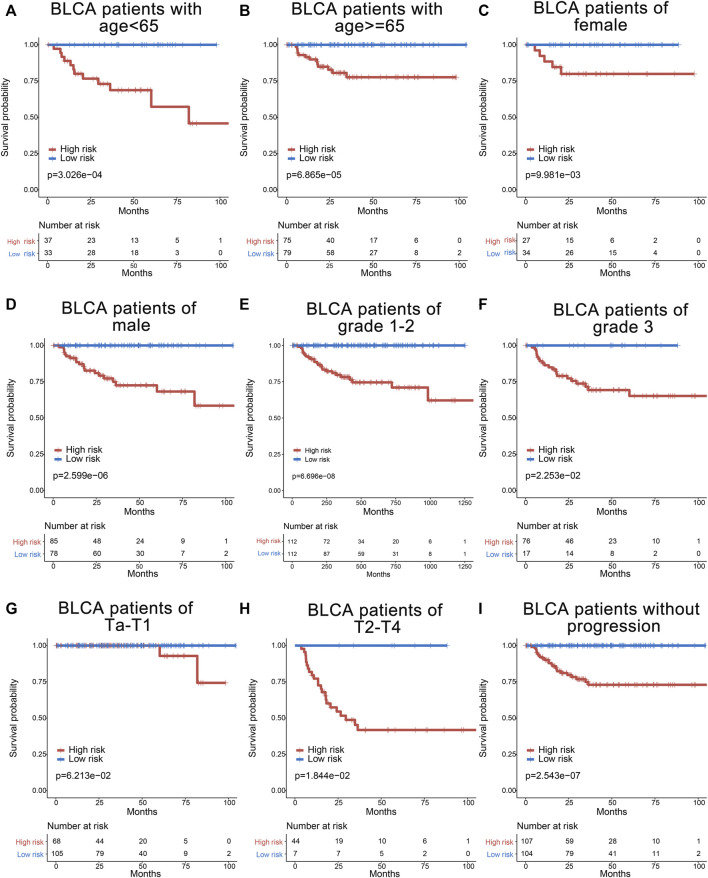
FIGURE 6.
Survival analyses of bladder cancer patients stratified by age, gender, grade, T stage, and tumor progression with the six-gene signature in GSE32894. The Kaplan–Meier curves for the young (age <65) and old (age ≥65) groups (A,B), for the female and male patients (C,D), for the grade 1–2 and grade 3 groups (E,F), for the low stage (Ta and T1) and high stage (T2–T4) groups (G,H), and for the non-progression (without progression to higher stage or grade) group (I).

