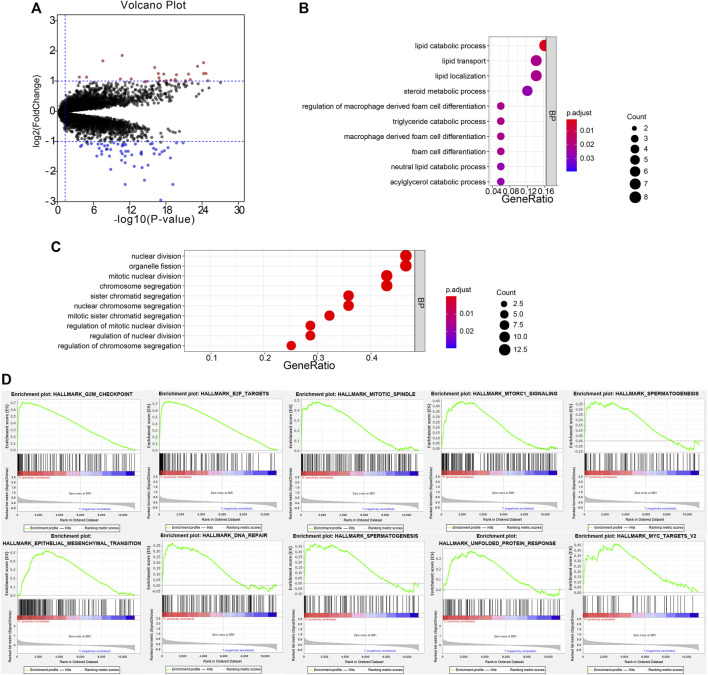
FIGURE 7.
Functional annotation of DEGs. The volcano plot based on the differentially expressed genes (A). Biological process analysis of the remarkable association of down- and upregulated genes (B,C). The top 10 enriched pathways in the high-risk group were analyzed by gene set enrichment analysis (D).

