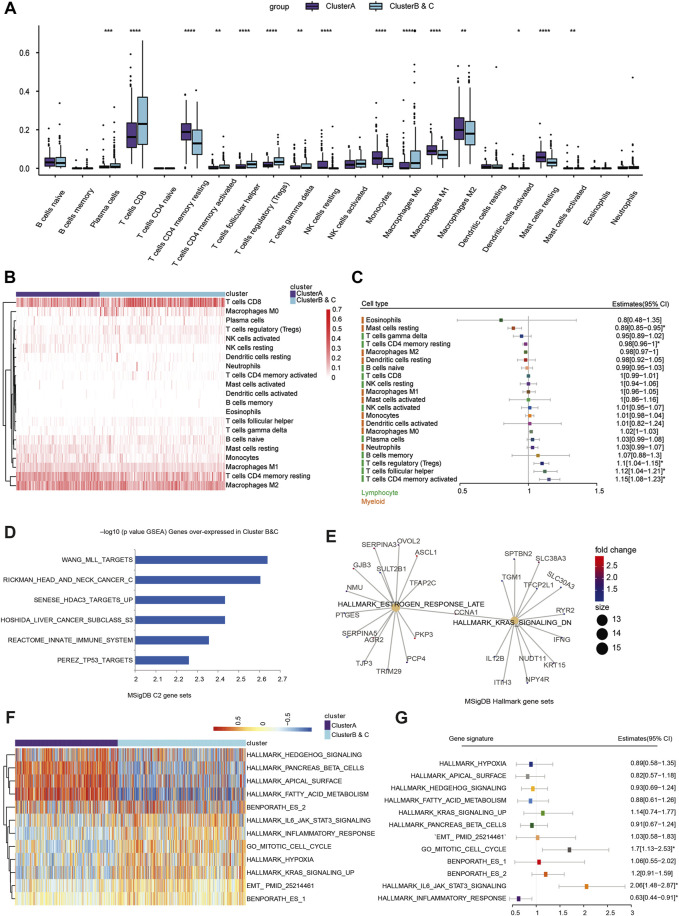
FIGURE 5.
Immune cell infiltration and function enrichment analysis of immunophenotyping clusters. (A, B) The CIBERSORT algorithm was performed to analyze the absolute proportion of 22 infiltrating immune cells and explore differential immune cell distribution in ccRCC samples from TCGA. (C) Prognostic value of lymphocyte-derived and myeloid-derived immune cell infiltration using univariate Cox regression analysis in a forest plot. (D, E) To evaluate the differences in biological function between the two immunophenotyping clusters, the Wilcox test was used to identify DEGs in the two immunophenotyping clusters. According to the screening criteria of |log2FC|>1 and adj.Pvalue<0.01 (Supplementary Materials), GSEA was used to explore the functional annotations of upregulated DEGs in Clusters B and C. (F) The GSVA algorithm suggested significantly enriched hallmarks in Cluster A and Clusters B and C. (G) Generalized linear model Cox regression model was used to test the contribution of each function to Clusters B and C and Cluster A.

