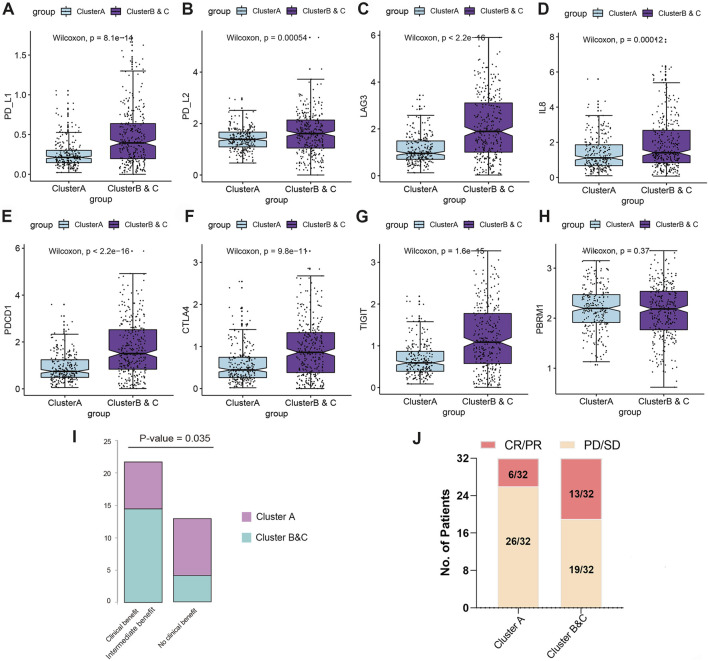
FIGURE 7.
Immunotherapy efficacy analysis of immunophenotyping clusters. (A–H) Expressions of immune checkpoint molecules, including PD-L1, PD-L2, LAG3, IL-8, PDCD1, CTLA-4, and TIGIT, and PBRM1, were compared using Students’ t test. (I) A total of 35 ccRCC patients receiving ICTs from the CA209-009 cohort with RNA-seq data and clinical responses to treatment. (J) Response status in 64 ccRCC patients receiving ICTs alone or combined with TKIs from the FUSCC cohort.

