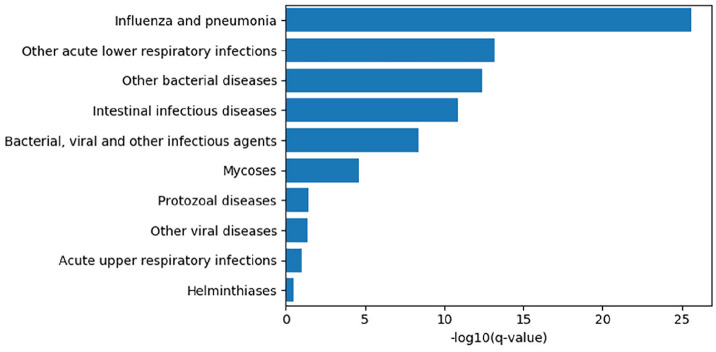
Figure 1.
The top 10 infection phenotypes associated with relative circadian amplitude among participants of the UK Biobank, by −log10 of the Benjamini-Hochberg q-values. Cases were extracted by lifetime occurrence of ICD-10 codes and associations computed by a linear model controlling for age, sex, socioeconomic status, body mass index, smoking status, and self-reported overall health. Relative amplitude was computed as a ratio (M10-L5/M10+L5) where M10 and L5 are are the participant’s average activity levels of the ten hours of highest activity and five hours of the lowest activity, respectively ( Witting et al., 1990).

