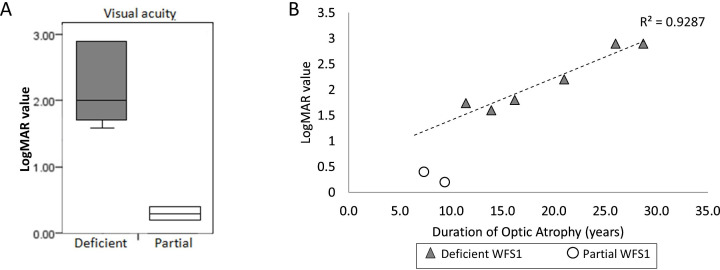
Figure 3.
Comparison of visual acuity data between groups.(A) Box plot comparing LogMAR values between deficient (n=6) and partial WFS1 (n=2) protein groups; showing statistically significant difference (p=0.04). logMAR value (visual acuity logarithm of the minimum angle of resolution) is the magnification requirement, the higher the logMAR value, the worse the visual acuity (<1.0 mild-moderate visual impairment, 1.0-1.3 sight impaired (partial sighted) >1.3 severely sight impaired (blind). 40–42 (B) Scatter graph showing logMAR values of each patient corresponding to the duration of optic atrophy from the diagnosis of OA (irrespective of the age of diagnosis). Plots for patients in deficient WFS1 protein group shown in grey triangles (n=6); regression line is drawn between the patients in deficient WFS1 protein group (correlation of determination is 0.93). Plots for patients in partial WFS1 protein group (SO1 + SO2) shown in white circles (n=2).

