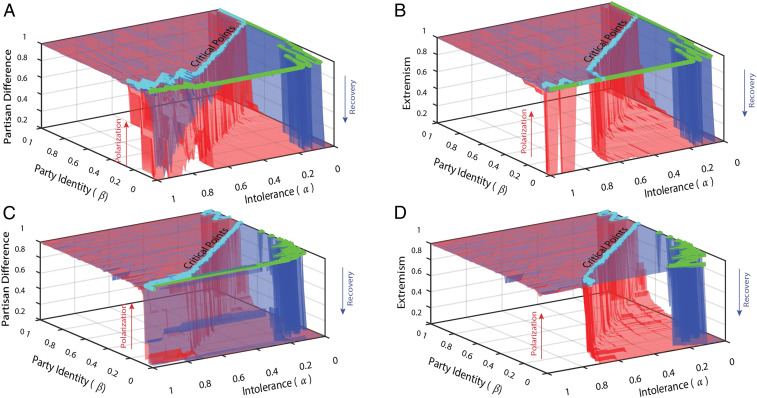
Fig. 5.
Robustness tests over the entire range of party identity and intolerance. The red surface shows the forward trajectory as polarization increases and the blue surface shows the recovery. The critical points (where the trajectory experiences a sharp change) are indicated in green along the cliff edge. The void between the red and blue regions corresponds to the hysteresis loops in Fig. 3 (in A and B) and Fig. 2 (in C and D). The critical values fluctuate widely for very small and . The width of the loops decreases along with the increase of the control parameters due to the larger decrease in the critical values for polarization compared to the decrease in critical values for recovery. In all four panels, polarization becomes increasingly hard to reverse as party identity and intolerance increase.

