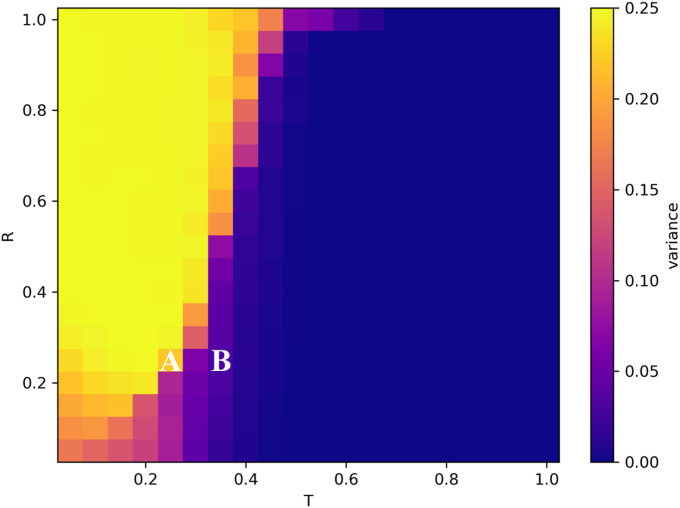
Fig. 3.
The effects of responsiveness (R) as a function of tolerance (T). Average polarization of the population’s ideological positions after 1,000,000 steps, averaged over 20 iterations for each pair. and are both varied over the range . There is a phase change from extreme polarization (yellow) with low to convergence (dark blue) with high . The phase change is largely independent of . A and B indicate the and cases shown in Fig. 2 on the boundary of the phase change.

