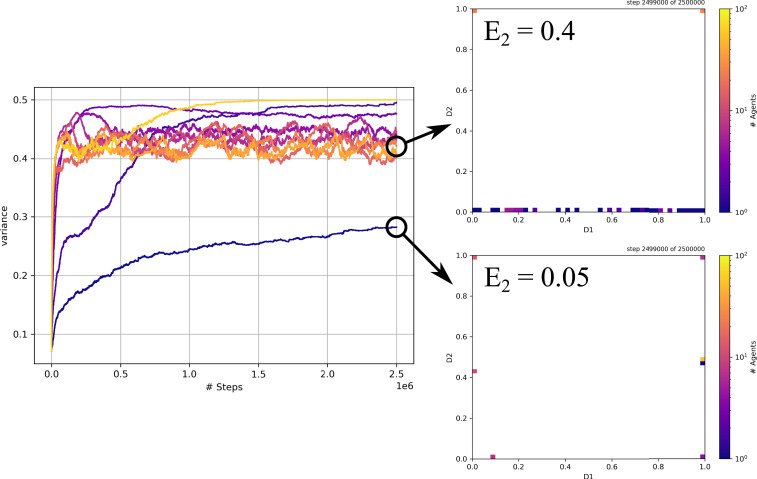
Fig. 6.
Avoiding maximum polarization with low exposure (E). Polarization of the population’s ideological positions over time when exposure on the first ideological dimension is fixed at and exposure on the second ideological dimension is varied over (dark blue to yellow). (Insets) Final configurations of the population after 2,500,000 steps for the (Top) and (Bottom) runs as a 2D histogram whose colors indicate concentrations of actors on a log-scale. See Movie S3 for animations.

