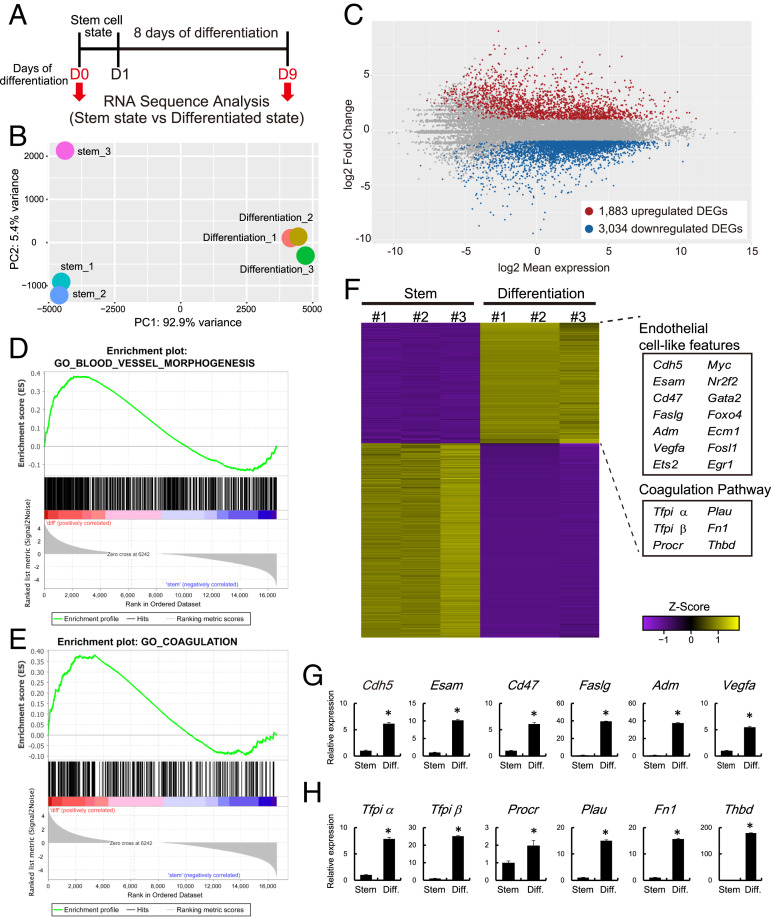
Fig. 1.
Transcriptome analysis of rat TS cells maintained in stem and differentiation states. (A) Schematic representation of RNA-seq analysis for stem and differentiated rat TS cells. Differentiation was induced by mitogen withdrawal. (B) PCA plot of stem and differentiated rat TS cells. (C) Bland-Altman plot showing the global transcriptomic changes in differentiated rat TS cells. Colored dots indicate DEGs (≥2-fold with a false discovery rate of P < 0.05; red: up-regulated, blue: down-regulated). (D and E) GSEA of DEGs associated with rat TS cells in the stem and differentiated states. Results for “Blood vessel morphogenesis” (D) and the “Coagulation” (E) gene sets are shown. (F) Heatmap showing the expression patterns of stem and differentiated rat TS cells. These DEGs are the same genes as those shown in C. Z score-transformed RPKM are shown. The endothelial cell–associated genes and the coagulation regulatory factors were up-regulated in differentiated rat TS cells. (G) RT-qPCR transcript validation for endothelial cell–associated genes. (H) RT-qPCR transcripts validation for coagulation regulatory factors. Asterisks in G and H denote P < 0.05.

