Fig. 2.
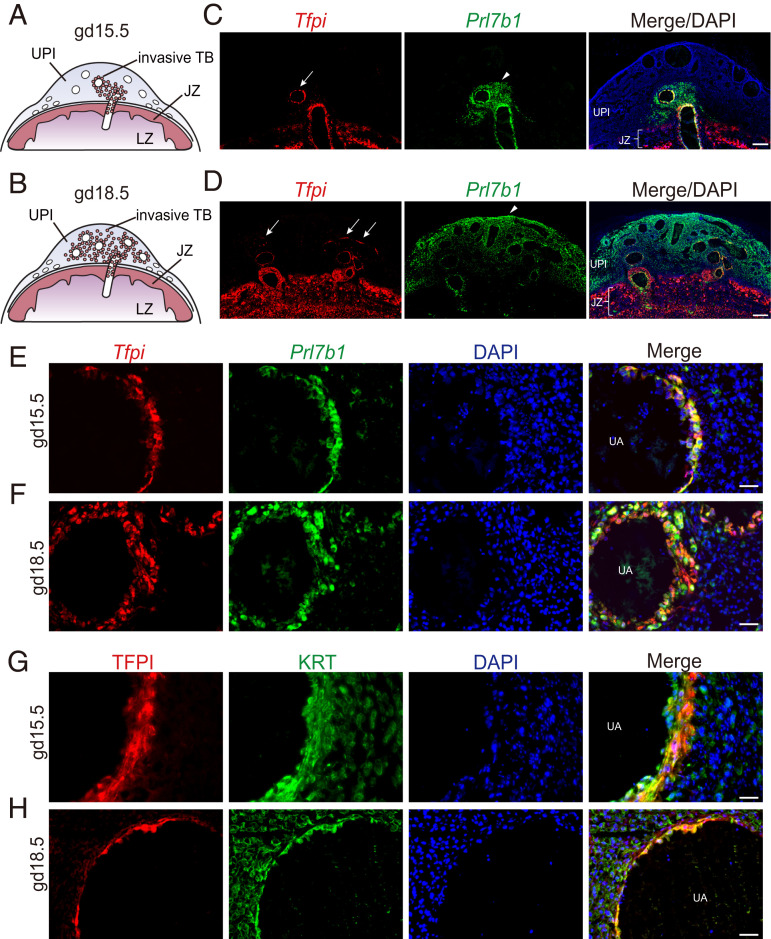
Localization of TFPI within the rat uterine-placental interface (UPI). (A and B) Schematic representations of gd 15.5 (A) and 18.5 (B) placentation sites, consisting of the junctional zone (JZ), the labyrinth zone (LZ), the UPI, and invasive trophoblast cells (TB). (C and D) Detection of Tfpi (red) and Prl7b1 (green) transcripts by in situ hybridization within gd 15.5 (C) and 18.5 (D) placentation sites. (Scale bar: 500 μm.) DAPI marks cell nuclei (blue). Arrows in the Tfpi images show localization associated with uterine spiral arterioles, and arrowheads in the Prl7b1 images demarcate the depth of intrauterine trophoblast cell invasion. (E and F) Higher-magnification images of Tfpi (red) and Prl7b1 (green) transcripts detected by in situ hybridization at the gd 15.5 (E) and 18.5 (F) uterine–placental interface. (Scale bar: 50 μm.) (G and H) Immunohistochemical detection of TFPI (red) and cytokeratin (KRT, green) proteins within endovascular trophoblast cells of gd 15.5 (G) and 18.5 (H) placentation sites. (Scale bar: 50 μm.)

