Fig. 3.
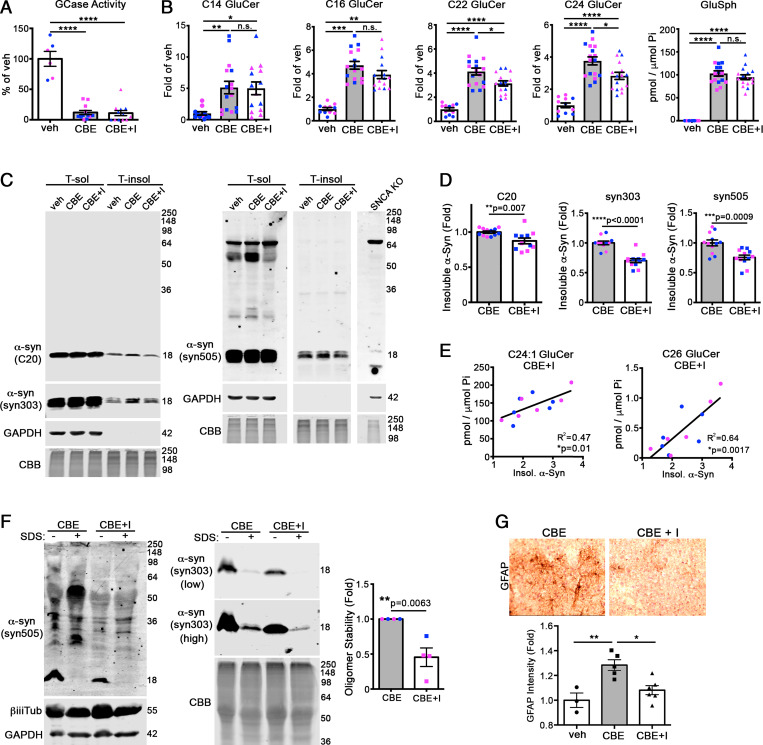
Preventing the accumulation of long-chain GluCers reduces the formation of pathological α-syn aggregates in mouse brain. The 3-mo-old wt mice were simultaneously treated with CBE and venglustat, a glucosylceramide synthase inhibitor (I), for 7 d followed by analysis of cortex. (A) GCase activity was measured in cortical lysates, normalized to total protein, and expressed relative to vehicle (veh) control (n = 12 per group). (B) GluCers and GluSph from cortex were quantified by supercritical fluid chromatography (SFC)-mass spectrometry (MS)/MS analysis and normalized to inorganic phosphate (Pi) (n = 12 per group). (C) Cortex was sequentially extracted and separated into triton X-100 soluble (T-sol) and insoluble (T-insol) fractions followed by Western blot for α-syn. C20 (rabbit pAb) and syn303 (mouse mAb) were sequentially probed on the same blot and detected with distinct, fluorescent secondary antibodies. Syn505 is shown from a separate blot. GAPDH and Coomassie Brilliant Blue (CBB) were used as loading controls. Lysates from α-syn knock-out lines (SNCA KO) were used to validate antibody specificity. (D) Quantification of insoluble α-syn normalized to total protein (CBB stain) (n = 12 mice per group). (E) Correlation of high-chain GluCers C24:1 and C26 with insoluble α-syn detected with syn303. (F) T-sol lysates were treated with or without 0.1% SDS to reveal stable, pathogenic oligomers followed by SEC analysis, quantified to the right with syn505 normalized to CBB (n = 4). CBE + veh/CBE + I pairs were analyzed on separate blots, and CBE + veh was assigned as onefold for each analysis. (G) Immunohistochemical analysis of the cortex of treated mice reveals a reduction in GFAP staining, suggesting reduced neural injury at day 7 post-injection. Values are the mean ± SEM; Student’s t test was used for D and F; ANOVA with Tukey’s post hoc test was used for A, B, and G; *P < 0.05, **P < 0.01, ***P < 0.001, and ****P < 0.0001. N.S., not significant.

