Fig. 1.
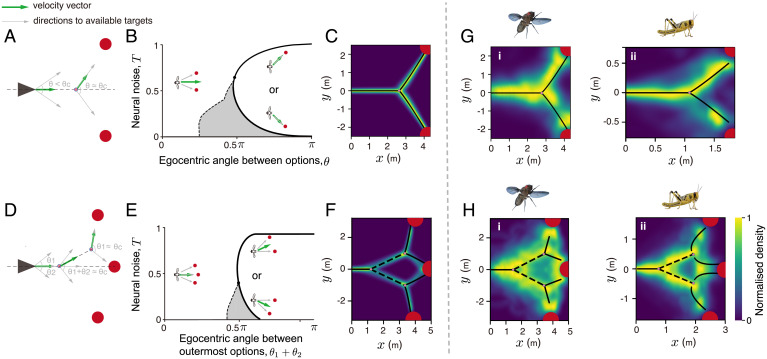
Geometrical principles of two-choice and three-choice decision-making. (A) Schematic of the binary decision-making experiments. This simplified representation shows that a sharp transition in the animal’s direction of travel is expected near a critical angle, θc. (B) A phase diagram describing the “critical” transition exhibited while moving from compromise to decision between two options in space. The shaded area (also in E) represents the region in parameter space where both the compromise and the decision solutions exist. (C) Density plot showing trajectories predicted by the neural model in a two-choice context. The axes represent xand y coordinates in Euclidean space. The black line (also in G) presents a piecewise phase transition function fit to the bifurcation. (D) Schematic of three-choice decision-making experiments, where the central target is on the angle bisector of the angle subtended by the other two targets. (E) A phase diagram describing the first critical transition when the individual chooses among three options. After the individual eliminates one of the outermost targets, it can decide between the two remaining options, similar to the two-choice phase diagram described in B. (F) Theoretical predictions for decision-making in a three-choice context. The dashed line (also in H) is the bisector of the angle subtended by center target and the corresponding side target on the first bifurcation point. SI Appendix, Table S1 shows the parameters used in C and F. (G and H) Density plots from experiments conducted with flies (i) and locusts (ii) choosing among two and three options, respectively. Note that the density plots presented here are for the nondirect tracks, which constitute the majority type of trajectory adopted by both flies and locusts (SI Appendix, Figs. S11 and S12). However, our conclusions do not differ if we use all unfiltered data (SI Appendix, Figs. S11 G and N and S12 I and R).

