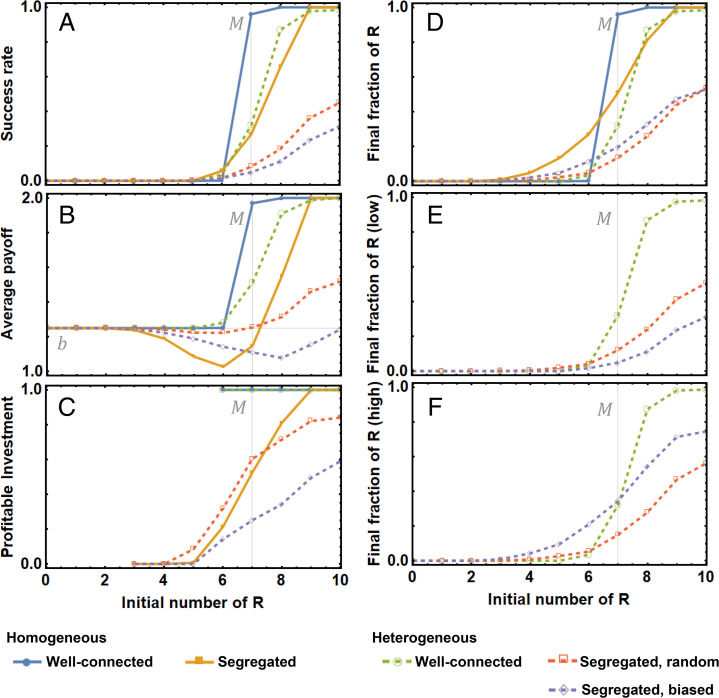
Fig. 2.
Impact of polarization on coordination. (A) Success rate, computed as the fraction of simulations that terminate with at least M R-players, making R profitable. (B) Average payoff, calculated over all players and simulations. (C) Profitable investment is the fraction of R-players who achieve their best outcome, oi. Notice that some points do not exist, as the simulation did not register any investments for those values. (D) Fraction of R-players in the population. (E) Fraction of R-players in the half of the population with the lowest valuations for R. (F) Fraction of R-players in the half of the population with the highest valuations for R. Quantities are the average final outcome of 104 simulations with different initial distributions of the location of R-players in the network, of sampled , and networks. Equilibrium was assumed after time steps. Simulations run for population size Z = 10, baseline benefit, b = 1.25, a threshold for achieving the collective outcome of M = 7 players, average valuation of collective outcome μ=2, and, for the heterogeneous valuations, Δμ = 1, z = 1/2, and σ = 0.01 (Fig. 1). Individual errors in determining the optimal strategy, depending on what the others are signaling, are controlled by β = 20. In SI Appendix, we provide an analytical analysis of the model in the absence of mistakes (β→∞) and large populations (SI Appendix, Sections 1–4), and we explore variations of M and β (SI Appendix, Section 7).

