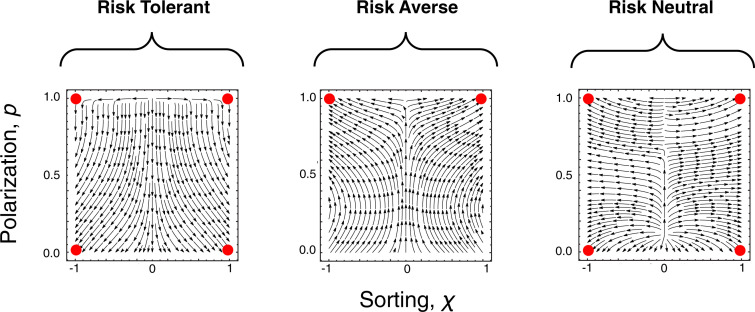
Fig. 2.
Polarization and sorting. Phase portraits illustrate the dynamics of polarization and degree of sorting under our model of economic interactions and party switching, with fixed identity groups. Arrows indicate the average selection gradient experienced by a local mutant against a monomorphic background (see Materials and Methods). Red dots indicate stable equilibria. (Left) When the decision process for social interactions considers group or party identity, both high and low polarization states are stable, but sorting is always high . (Center) However, when the environment is risk averse, only high polarization and high sorting are stable. (Right) And finally, when the environment is risk neutral, the system returns to bistable polarization with high sorting. These plots show dynamics for , , , , , and . The phase portraits here show the selection gradient experienced by a monomorphic population in which parties and groups are of equal size. Dynamics under alternate decision processes (Table 1) and different parameter choices are shown in SI Appendix.

