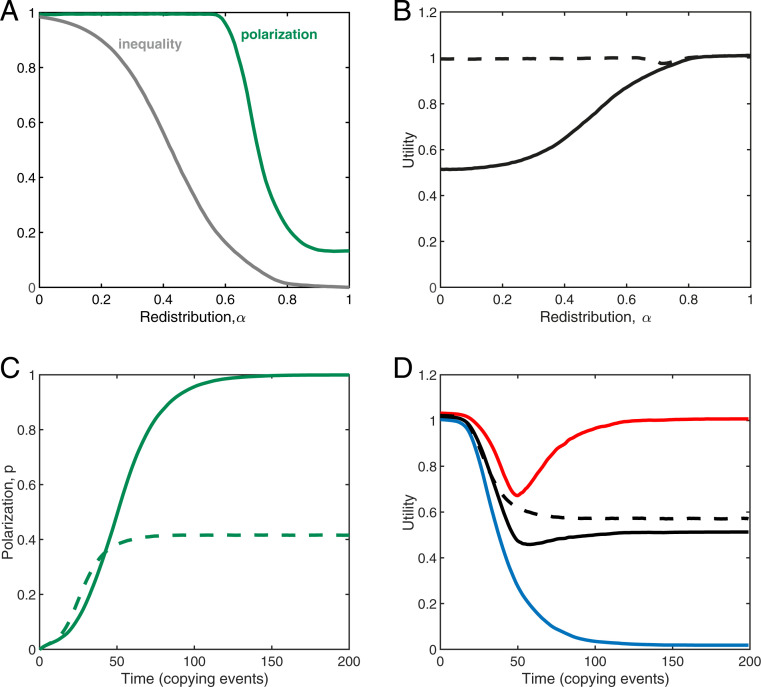
Fig. 4.
Redistribution and inequality. (A and B) Ensemble mean equilibria and (C and D) time trajectories for a population initialized in a low-polarization state, from individual-based simulations in the presence of wealth redistribution (Eq. 4). We show results in the case of no underlying economic inequality, (dashed lines), as well the case of high underlying inequality, (solid lines). Results shown here arise from a decision process that attends to group or party identity, and sorting is fixed exogenously at . (A) When public goods are not multiplicative ( and ), and redistribution is absent (), overall inequality (gray line, measured as the relative difference in utility; see SI Appendix) and polarization (green line) are high. With increasing rates of redistribution, first, overall inequality and, then, polarization decline to zero. (B) Increasing redistribution increases overall utility toward the level achieved when underlying inequality is absent. (C) When public goods increase overall utility ( and ), redistribution (here ) can act to magnify both polarization and inequality over time, compared to a fixed environment without feedback via redistribution. (D) Overall inequality initially has a relatively small impact on population mean utility in a population initialized in a low-polarization state (black lines), but redistribution is seen to magnify the effects of underlying inequality, with the richer group (red line) experiencing a transient decline in utility as polarization evolves before returning to a value close to maximum, while the poorer group (blue line) suffers an irreversible decline toward utility close to zero. Plots show ensemble mean values across replicate simulations, for groups of 1,000 individuals each. Success probabilities and benefits are fixed at , , , with and , while . Evolution occurs via the copying process (see Materials and Methods) with selection strength , mutation rate , and mutation size .

