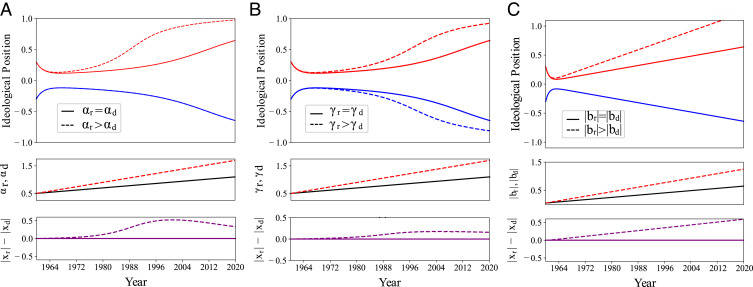
Fig. 4.
Comparison of the model dynamics ([1] and [2]) for the three hypotheses on political elite response mechanism. Plotted as a function of time in years starting in 1959 are (A–C, Top) (red) and (blue); (A–C, Middle) (black is overlay of solid red, solid blue, and dashed blue); and (A–C, Bottom) (purple). For all simulations, , , and y. (A) Positive feedback from self-reinforcement (hyp. A): comparison of symmetric versus asymmetric increase in and over time. , , , and . Solid lines correspond to the symmetric conditions . While , and remain near the center, and when , they diverge symmetrically away from the center. Dashed lines correspond to the asymmetric conditions . In this case diverges sooner and ultimately more significantly than since sooner than . (B) Positive feedback from reflexive partisanship (hyp. B): comparison of symmetric versus asymmetric increase in and over time. Conditions are identical to those for A except that the roles of and are swapped and the roles of and are swapped. For the symmetric conditions (solid lines), and diverge symmetrically away from the center. For the asymmetric conditions (dashed lines), the asymmetry in the divergence of and is not as significant as in A. (C) Additive response (hyp. C): comparison of symmetric versus asymmetric increase in and over time. , and . Solid lines correspond to the symmetric conditions and dashed lines to . and linearly track and , respectively.

