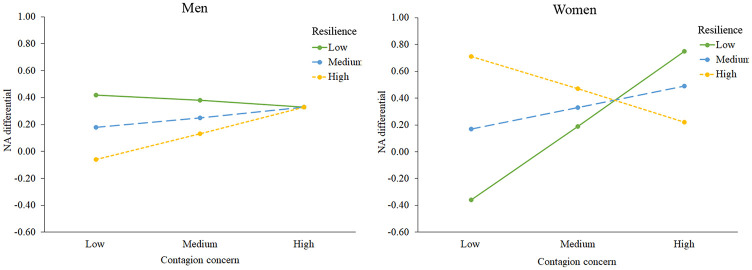
Figure 2.
Graphical representation of the results of the second-order interaction between contagion concern, resilience, and gender as a predictor of the NA differential (NA Timepoint 2 − NA Timepoint 1). Both panels show the value of the NA differential as a function of contagion concern and resilience level for men (left-hand panel) and women (right-hand panel). Values for contagion concern and resilience are mean-centered. Values for each level of contagion concern correspond to −1.56 (low), 0 (medium), and 1.56 (high); for levels of resilience the correspondence is −5.48 (low), 0 (medium), and 5.48 (high).

