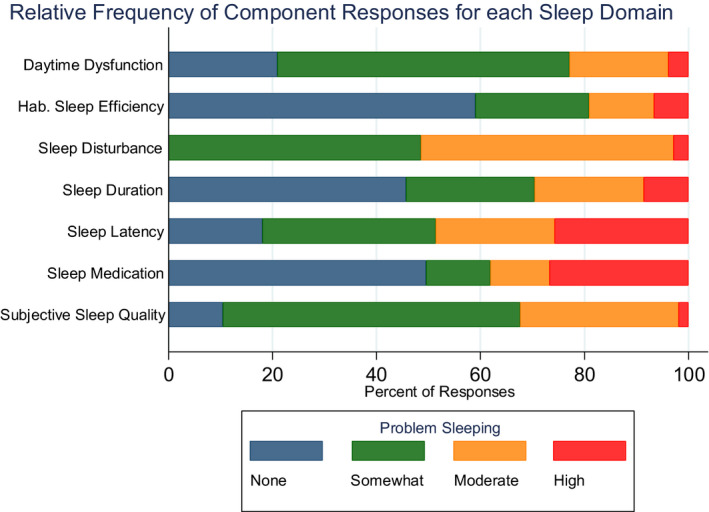
FIGURE 1.

Relative Frequency of Component Responses for each Sleep Domain among Nursing Faculty (N = 105). Note. Figure 1 displays the proportion of response categories (0–3) for each sleep domain, with ‘0’ representing no sleep problems and ‘3’ indicating highly problematic in that domain. Across each domain (y axis), the stacked bars represent each response added up to 100%, and the width of each colour/bar represents the proportion of responses
