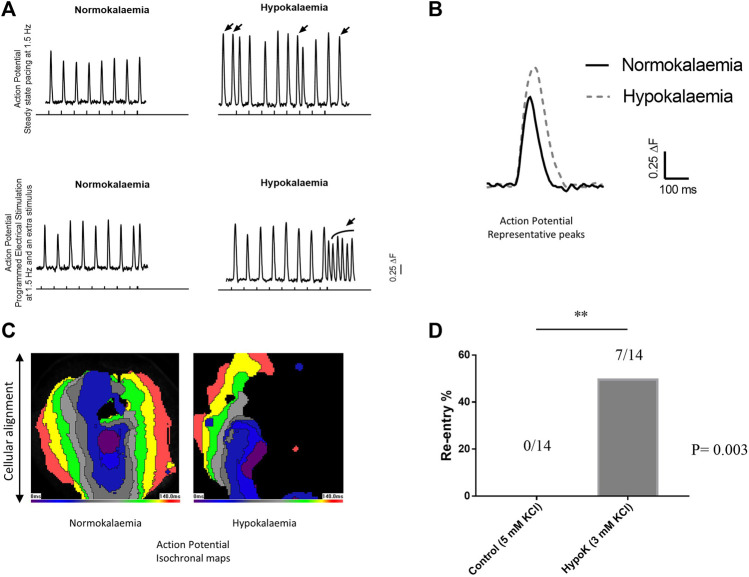
FIGURE 2.
(A) Upper panel shows the steady state pacing at 1.5 Hz and the bottom panel shows programmed electrical stimulation. The perpendicular lines along the x-axis are the pacings from the external stimulator. Arrows over the peaks show premature action potentials (APs). (B) Representative AP tracings of normokalaemic and hypokalaemic samples. (C) Isochronal maps of the normokalaemic sample (left panel) with normal AP propagation from the center towards the edges and the hypokalaemic sample (right panel) showing spiral AP propagation circulating the center. (D) Re-entry percentages of normokalaemic and hypokalaemic samples.

