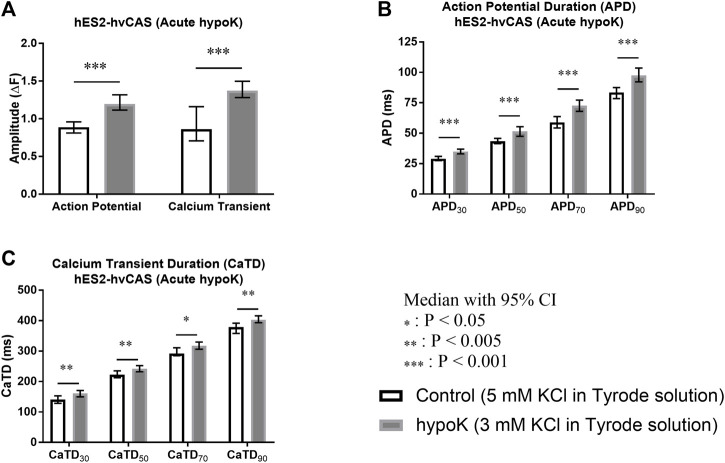
FIGURE 3.
Human embryonic stem cell (hES2)-derived human ventricular cardiac anisotropic sheet (hvCAS) paced at 1.5 Hz during acute hypokalaemic (hypoK) experiment where the treatment was for 15 min before data acquisition. Number of samples is represented by n where the first number refers to control (5 mM KCl in Tyrode solution) samples and the second number refers to hypoK (3 mM KCl in Tyrode solution) samples. (A) Action Potential (AP) Amplitude (n = 12, 14) and Calcium Transient (CaT) Amplitude (n = 12, 13). ΔF represents the change in fluorescence intensity. (B) AP Duration (APD) at 30, 50, 70 and 90% fluorescence decay intervals from the peak fluorescence intensity represented by APD30, APD50, APD70 and APD90. (n = 13, 15). (C) CaT Duration (CaTD) at 30, 50, 70 and 90% fluorescence decay intervals from the peak fluorescence intensity represented by CaTD30, CaTD50, CaTD70 and CaTD90. (n = 11, 10). Amplitude of AP and CaT increased in hypokalaemic condition (asterisks, p < 0.001) and also for the APD and CaTD at 30, 50, 70 and 90% decay (asterisks, p < 0.001 for APD and p < 0.005, p < 0.05 for CaTD).

