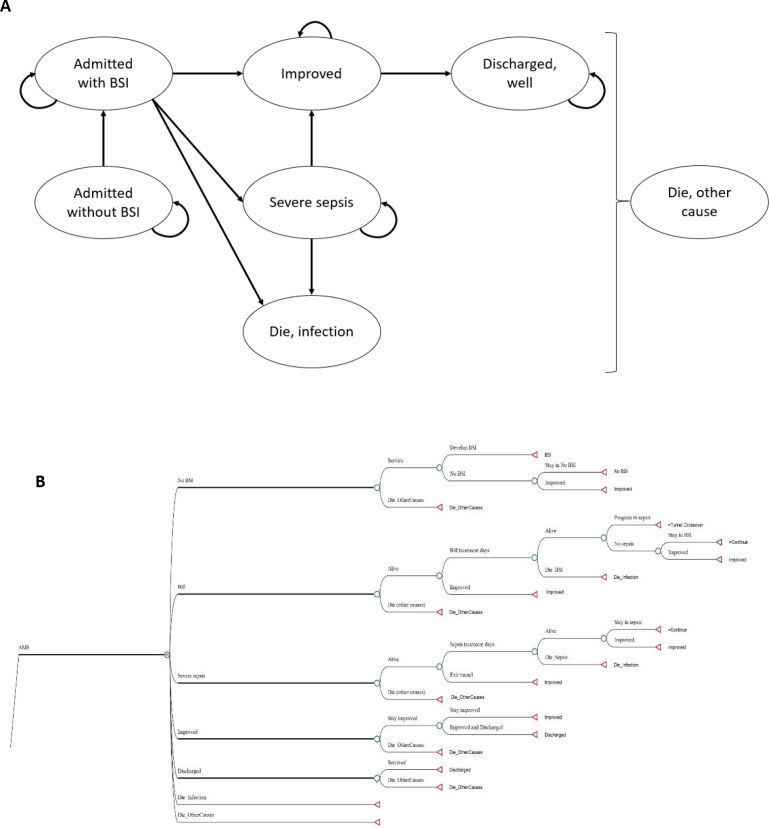
Figure 1.
Schematic presentation of health state model. (A.) Markov state transition diagram of inpatients with bloodstream infections. The seven circles show possible conditions or health states while the arrows imply transitions of patients among different health states. (B.) illustrative structural model of an AMS intervention strategy. The usual care strategy also has the same model structure, but with varied input values. During each cycle, individuals could be in any of the seven health states and the transitional probabilities determine their possible transition between health states. A chance node (circle) denotes the alternative possibilities or possible outcomes, whereas a terminal node (triangle) marks the endpoint of a scenario. AMS, antimicrobial stewardship; BSI, bloodstream infection.

