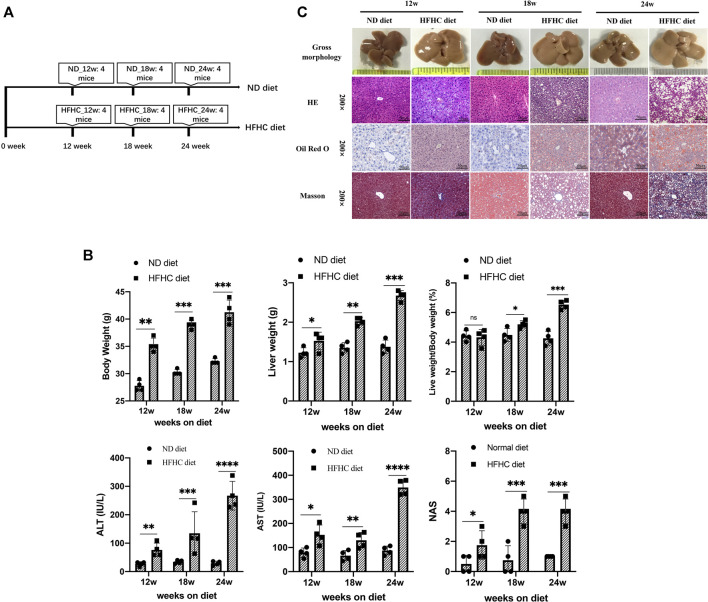
FIGURE 1.
Establishment of a mouse model of HFHC-diet–induced NAFLD. (A) Schematic overview of experimental design (n = 4 for each group). (B) Body weights, liver weights, liver/body weight ratio, serum ALT and AST, and NAS scores in mice fed on ND or HFHC diet for 12, 18, and 24 weeks. (C) Gross morphology, H&E, Oil red O and Masson`s trichrome staining of hepatic tissues from ND or HFHC-fed mice. Values represent mean ± standard deviation with *p < 0.05, **p < 0.01, ***p < 0.001, ****p < 0.000 and ns vs HFHC_12w group. Abbreviation: HFHC, high-fat high-cholesterol; NAFLD, non-alcoholic fatty liver disease; ALT, alanine transaminase; AST, aspartate transaminase; NAS, NAFLD activity score; ND, normal diet; ns, not significant.

