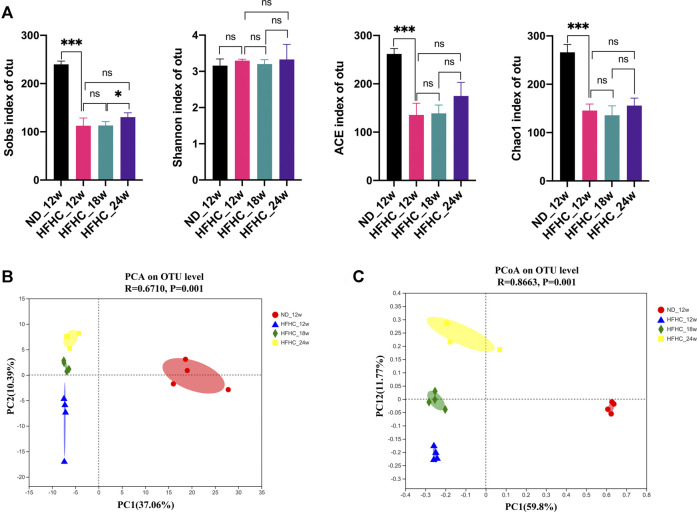
FIGURE 2.
α-diversity and β-diversity analyses of the gut microbiota in mice at the different stages of NAFLD. (A) Sobs index, Shannon index, ACE index, and Chao1 index on the OTU level. (B) PCA analysis. (C) PCoA analysis based on Bray-Curtis distance. Values represent mean ± standard deviation with *p < 0.05, ***p < 0.001 and ns vs HFHC_12w group. Abbreviation: NAFLD, non-alcoholic fatty liver disease; OTU, Operational taxonomic unit; PCA, principal component analysis; PCoA, principal coordinate analysis; HFHC, high-fat high-cholesterol; ns, not significant.

