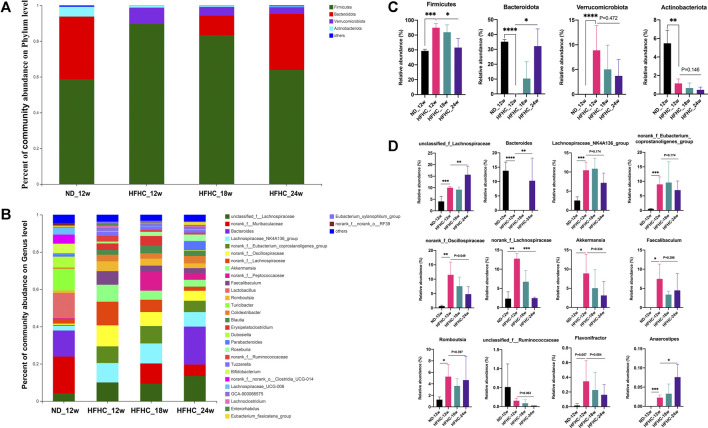
FIGURE 3.
Altered gut microbiome at the different stages of NAFLD. Relative abundance of bacterial communities from mice at the different stages of NAFLD at the phylum (A) and genus level (B). Comparison of average abundance of specific gut bacteria from mice at the different stages of NAFLD at the phylum (C) and genus level (D). Values represent mean ± standard deviation with *p < 0.05, **p < 0.01, ***p < 0.001 and ****p < 0.000 vs HFHC_12w group. Abbreviation: NAFLD, non-alcoholic fatty liver disease; HFHC, high-fat high-cholesterol.

