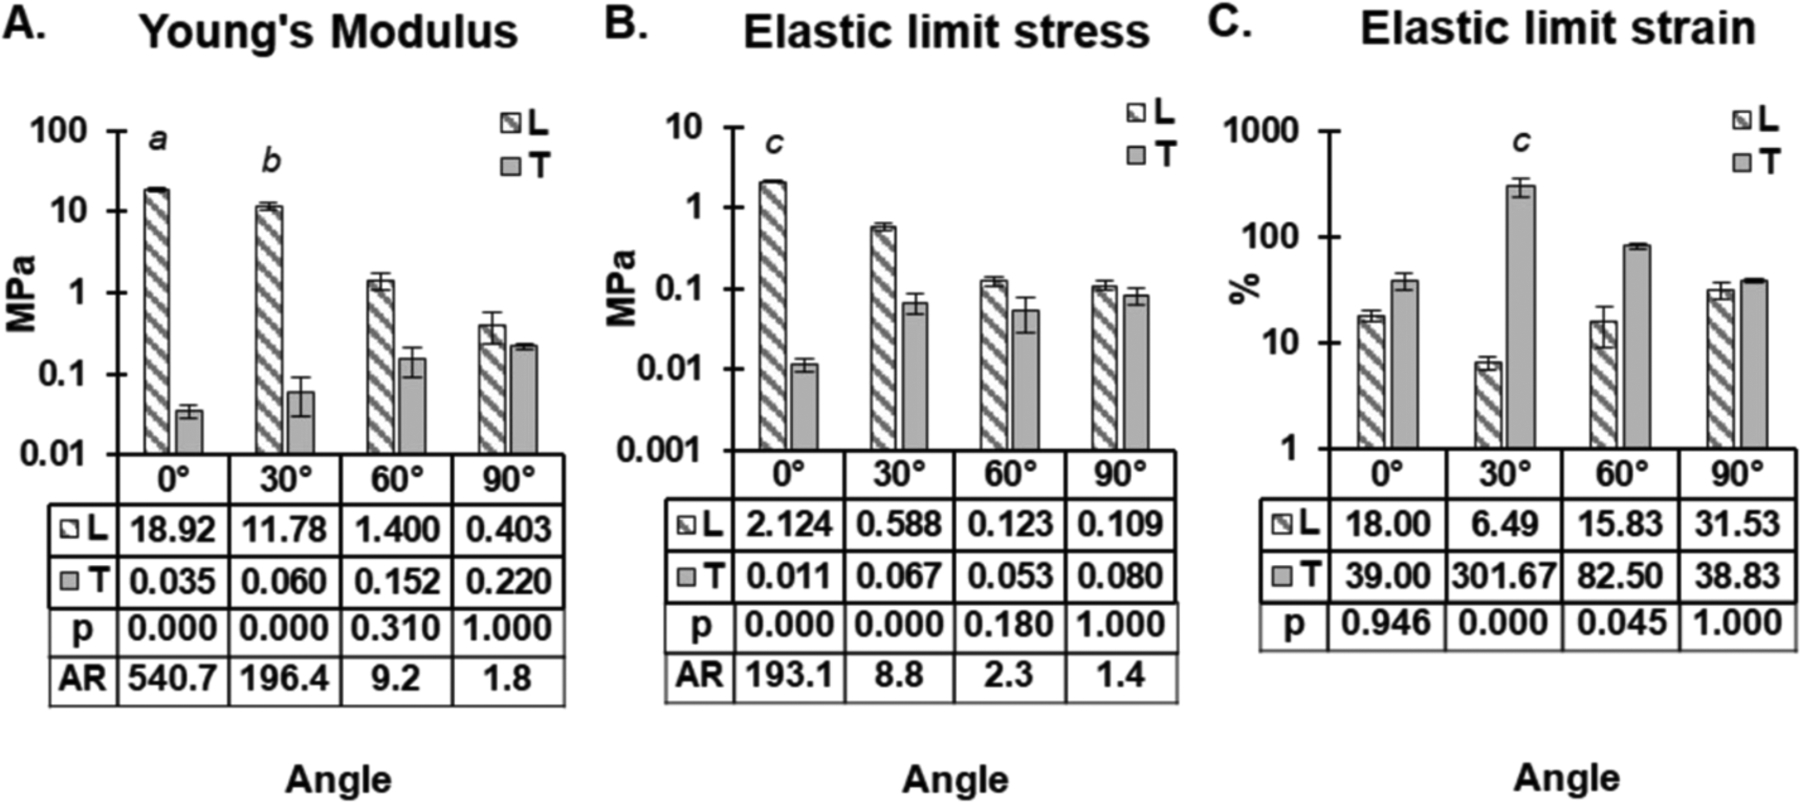
Figure 4.

Bulk tensile mechanical properties of architected scaffolds. (A) Young’s modulus of scaffold below 20% strain. (B) Elastic limit stress and (C) the elastic limit strain of the four scaffold along their longitudinal (L) and transverse (T) axes. Mean values and p values can be found in the table below each graph. AR = anisotropic ratio of values between longitudinal axis and transverse axis. Log axes were used to ensure all data could be visualized. a and b = significantly different to all other values apart from each other. c = significantly different to all other values, n = 3.
