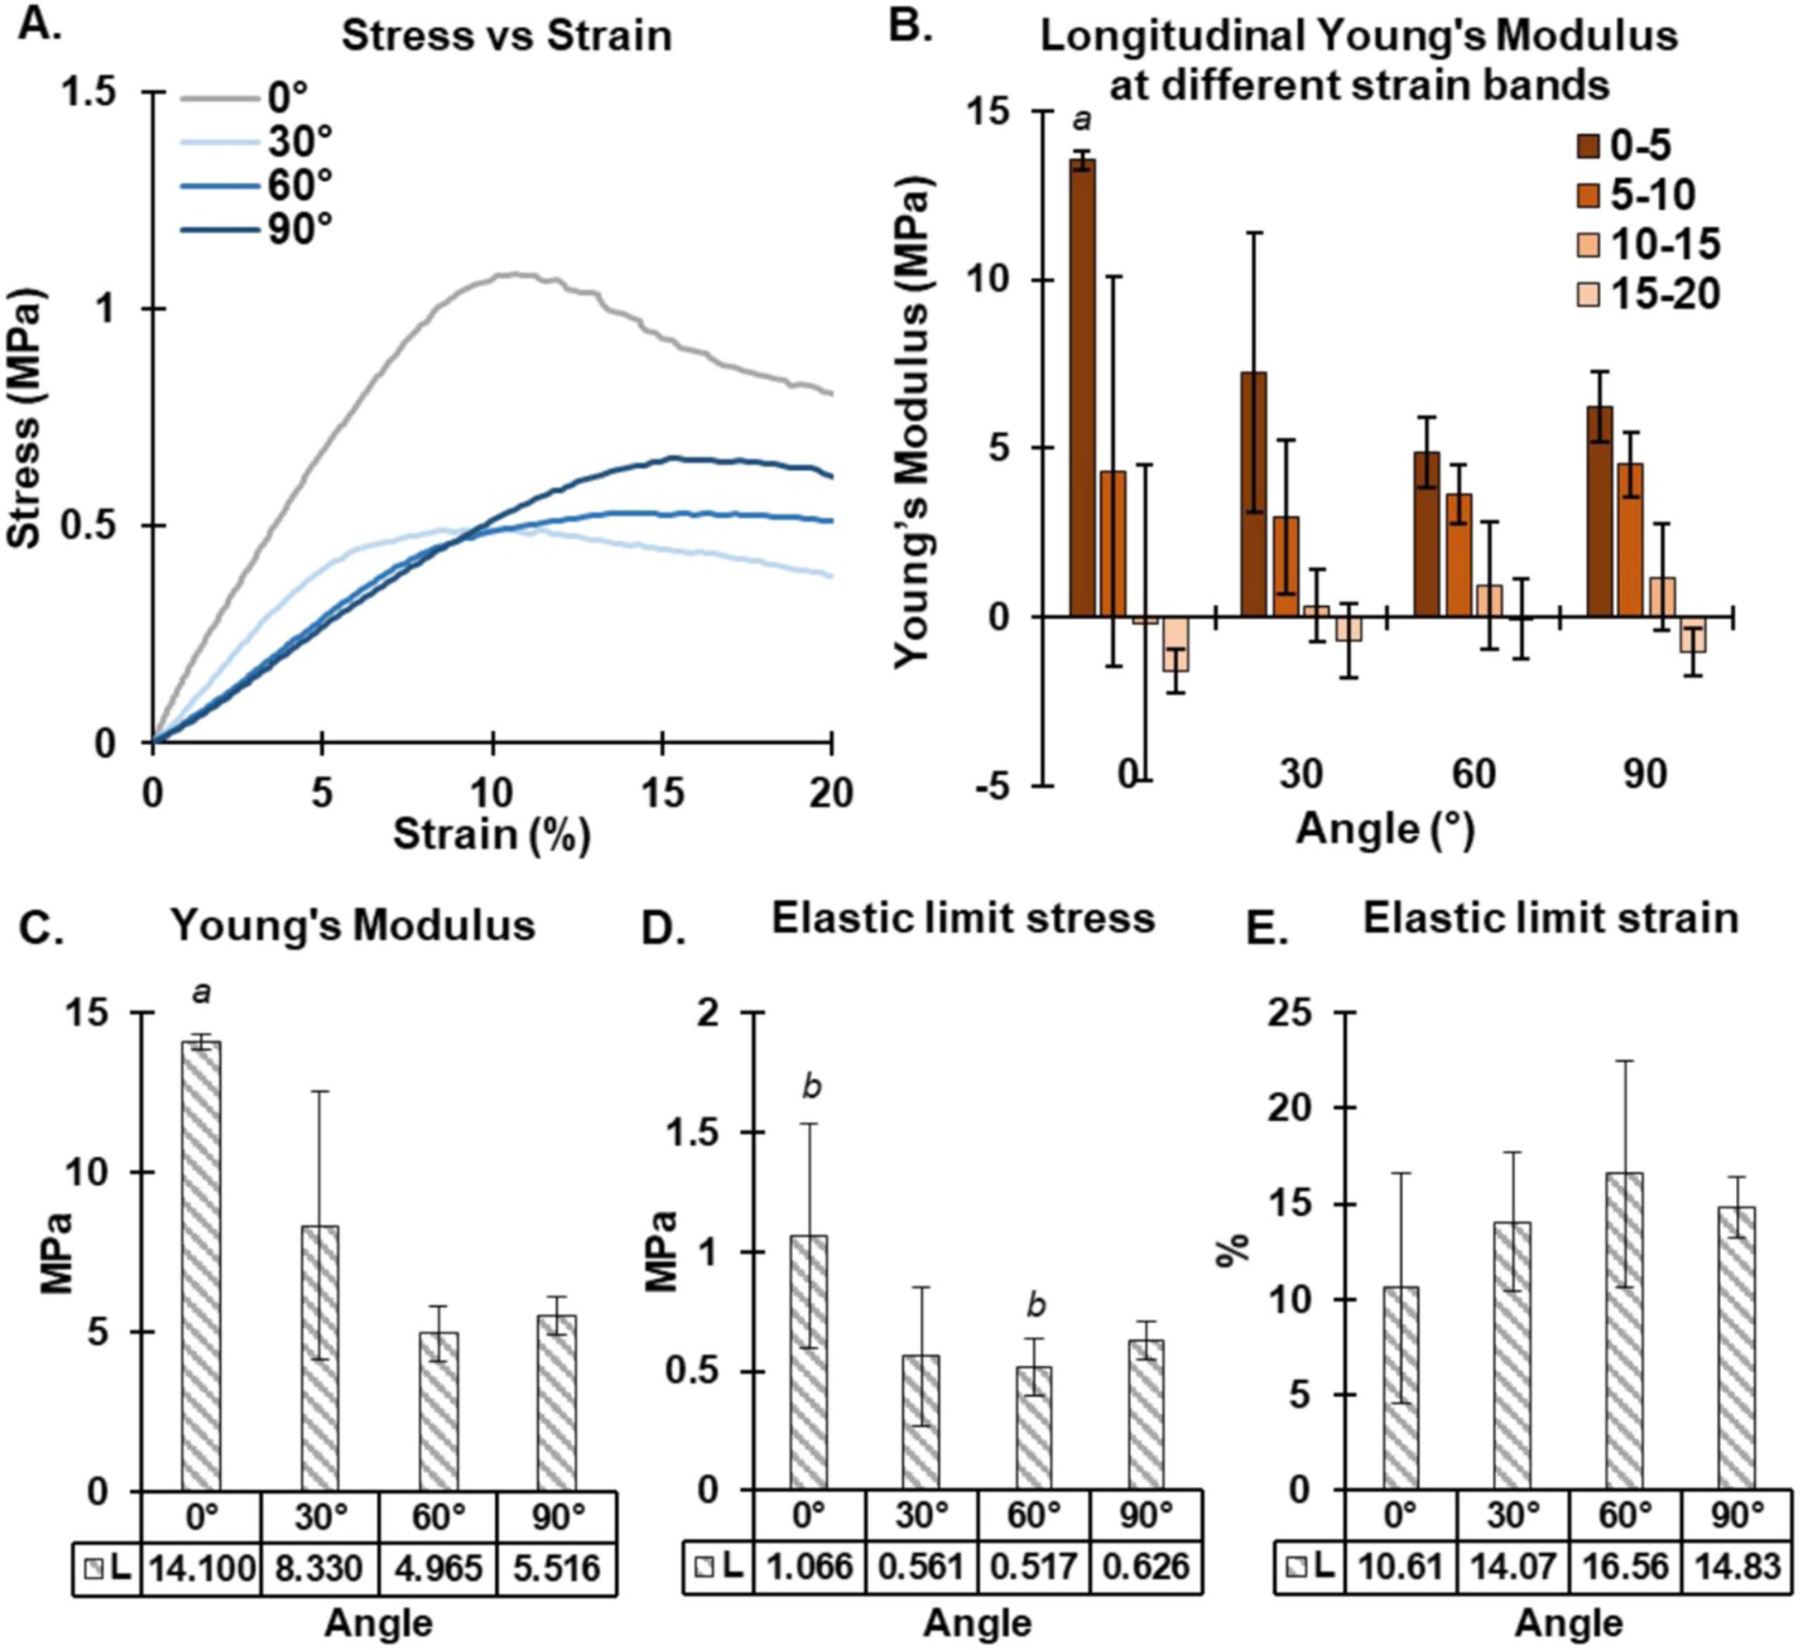
Figure 8.

Tensile analysis of architected composite scaffolds. (A) Representative stress vs strain curves (0%–20% strain region) for all four scaffolds. (B) Incremental Young’s moduli for 0%–20% strain along the longitudinal axis. (C) Bulk tensile Young’s modulus of the composite scaffolds below 20% strain. (D) Elastic limit stress and (E) the elastic limit strain of the four scaffolds along their longitudinal axis. a = significantly different to all other values, b = significantly different to each other, n = 4.
