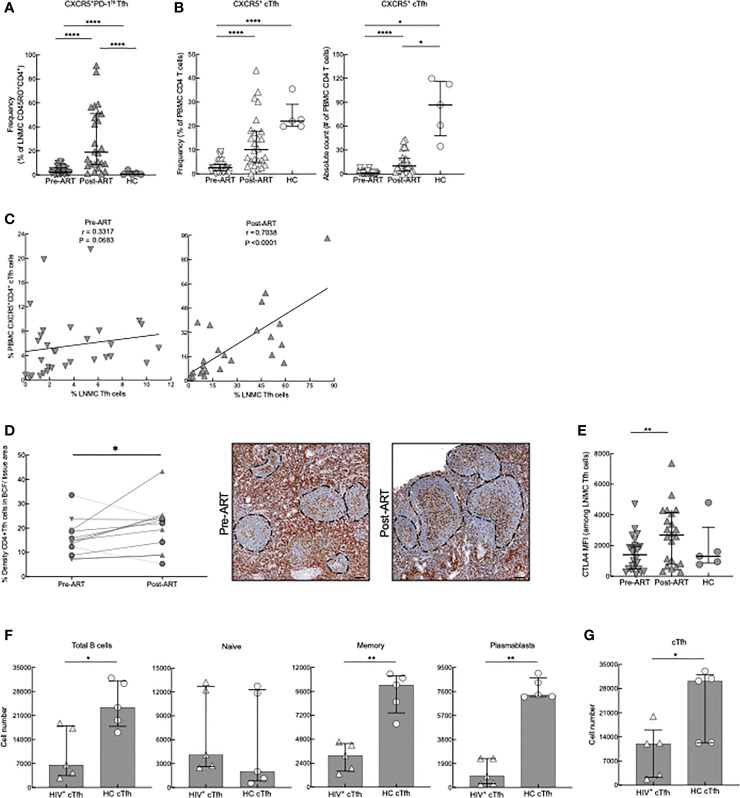
Figure 2.
Tfh- and cTfh cell phenotyping and in vitro function. (A) Frequencies of CXCR5+PD-1hi Tfh cells of pre-ART (n = 33), post-ART (n = 26) and HC (n = 5) participants. ****p < 0.0001 by bootstrapped Welch Two Sample t-test with 10,000 iterations on full set; data are not statistically significant unless noted. (B) Frequencies and absolute counts of CXCR5+ CD45RO+ cTfh cells pre-ART (n = 33), post-ART (n = 26), and HC (n = 5) participants. *p <0.05, ****p < 0.0001 by bootstrapped Welch Two Sample t-test with 10,000 iterations on full set; data are not statistically significant unless noted. (C) Correlation between pre-ART PBMC cTfh and pre-ART LNMC Tfh cells (left panel) and between post-ART PBMC cTfh versus post-ART LNMC Tfh cells (right panel). Spearman’s rank correlation; data are not significant unless noted. (D) Quantification of Tfh cells in situ performed pre-ART (n = 11) and post-ART (n = 12) using double IHC staining for CD4 (brown) and myeloid cells (red) to determine density of CD4+ T cells within B-cell follicles (BCF); IRIS indicated by circles. Representative images are shown pre- and post-ART for one patient showing increase of CD4+ T cells within BCF. *p < 0.05 by one sample t test and Wilcoxon test. Scale bars are 200um. (E) CTLA4 expression on LNMC CXCR5+PD-1hi Tfh cells pre-ART (n = 26), post-ART (n = 22), and HC (n = 5) participants. **p < 0.01 by bootstrapped Welch Two Sample t-test with 10,000 iterations on full set; data are not significant unless noted. (F) cTfh cells from HC (n = 5) or post-ART HIV+ (n = 5) participants cocultured with unrelated HC CD19+ B cells. Absolute cell numbers of total B cells and B-cell subsets after 7 days in coculture. (G) Absolute numbers of cTfh cells at day 7. *p < 0.05, **p < 0.01 by Mann-Whitney U test.

