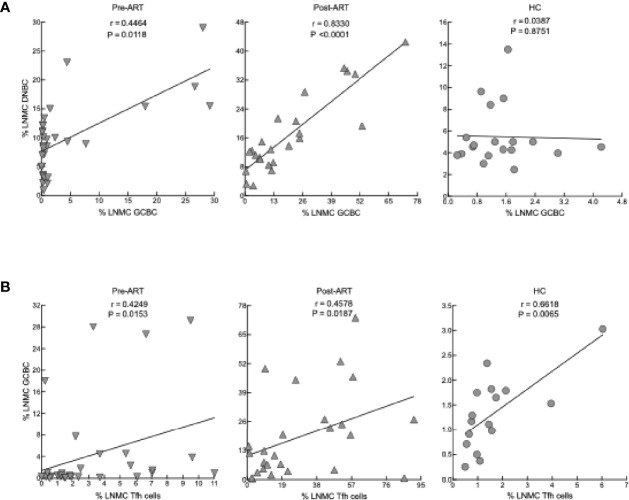
Figure 5.
Correlation between cellular phenotypes in LNMC. (A) Correlation between frequency of GCBC and DNBC in LNMC of pre-ART (n = 31), post-ART (n = 24) and HC (n = 19) participants. (B) Correlation between frequency of Tfh cells and GCBC in LNMC of pre-ART (n = 31), post-ART (n = 25) and HC (n = 16) participants. Spearman’s rank correlation; data are not statistically significant unless noted.

