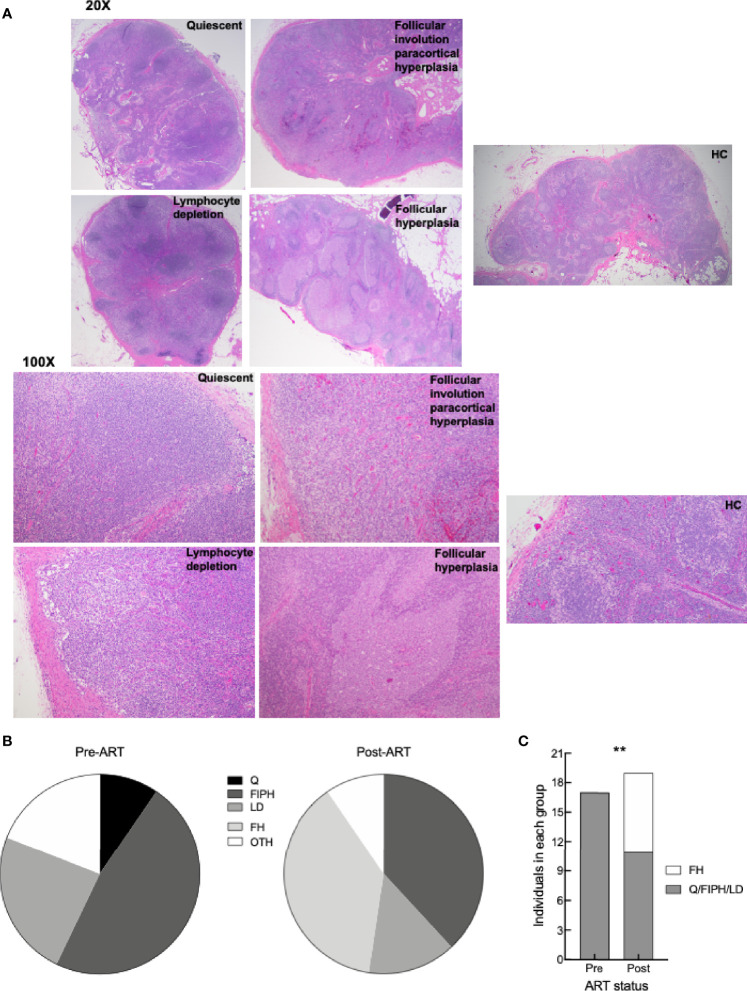
Figure 6.
LN histologic characterization. (A) Representative images of H&E staining of LN from HC, HIV+ pre- and post-ART participants (identifiers in S1 Table ) depicting the four groups: quiescent (L017 pre-ART), follicular involution with paracortical hyperplasia (L090 pre-ART and HC6), lymphocyte depletion (L061 pre-ART), and follicular hyperplasia (L003 post-ART); 20X and 100X magnification. (B) Pie charts depicting proportion of LN pre-ART (n = 21) and post-ART (n = 21) characterized as quiescent (Q), follicular involution with paracortical hyperplasia (FIPH), lymphocyte depletion (LD), follicular hyperplasia (FH), and other (OTH). s(C) Proportion of LN pre-ART (n = 17) and post-ART (n = 19) that were grouped as FH or non-FH. **p < 0.01 by Fisher’s exact test.

